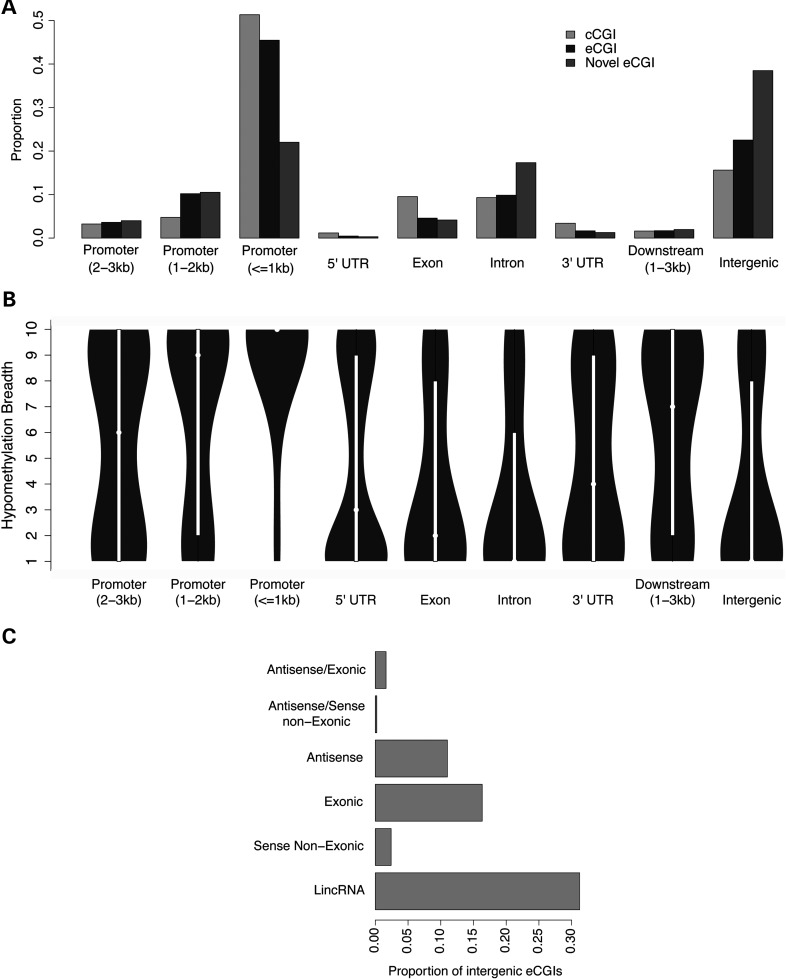
Figure 6.
(A) Distribution of CGIs in relation to the UCSC annotation of genes. The promoter region was defined as 3 kb upstream of the TSS, downstream region as immediate downstream genes within 3 kb and intergenic regions for distances >3 kb from genes in both directions. (B) Hypomethylation breadths (number of tissues with eCGIs) of different regions. (C) Proportion of ncRNA classes found within 3 kb of intergenic eCGIs.

