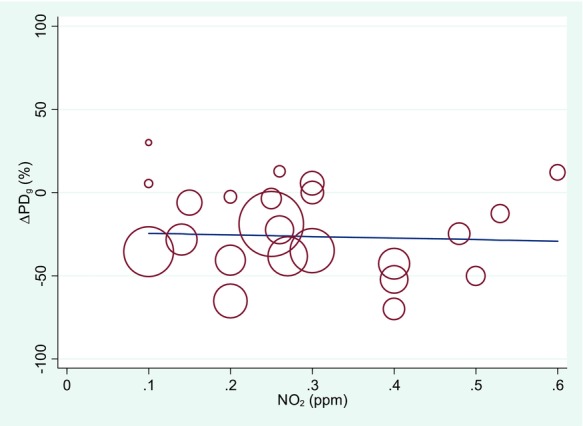
Figure 3.

Association between NO2 exposure and airway hyper-responsiveness in asthmatics based on meta-regression of the difference between airway challenge provocative dose following exposure to NO2 vs. air. This figure illustrates the use of a bubble plot to display meta-regression results. Each circle represents the findings from one study at a given exposure, while the area of each circle is proportional to the weight given to each measure in the meta-regression. Adapted from Goodman et al.19
