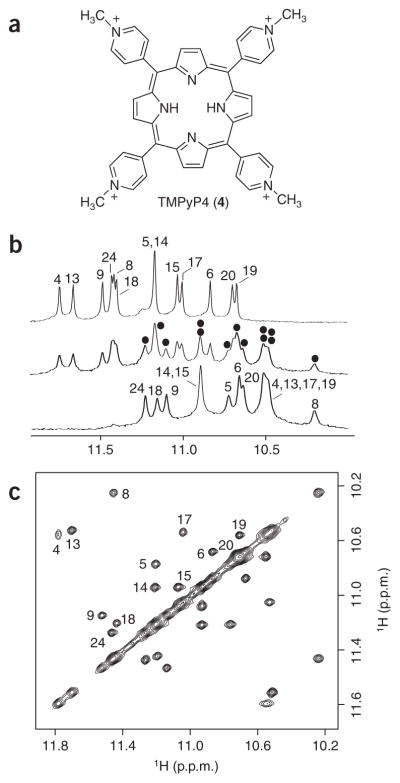
Figure 4.
NMR study of the Pu24I–TMPyP4 complex. (a) The structure of the cationic porphyrin TMPyP4. (b) The interaction between the Pu24I quadruplex and TMPyP4 as monitored by imino proton NMR spectra. Top, middle and bottom spectra are for samples with the [TMPyP4]/[DNA] ratio being 0, 0.5, and 1, respectively. Peaks are labeled with residue numbers. At [TMPyP4]/[DNA] = 0.5, peaks for the Pu24I quadruplex–TMPyP4 complex are marked with black dots. (c) NOESY spectrum (mixing time, 75 ms) of Pu24I in the presence of 50% TMPyP4. Exchange cross-peaks between the free and bound Pu24I quadruplexes are labeled with residue numbers. Pu24I concentration was 0.2 mM for b and 0.4 mM for c.

