
Figure 4. Models of nucleosomal engagement.
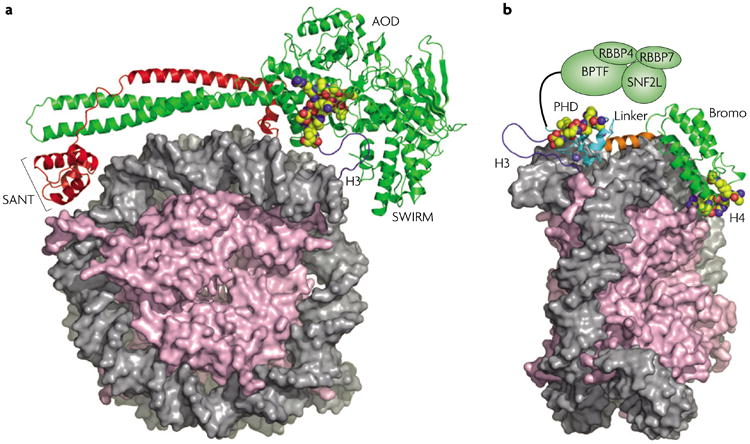
a | A model of the LSD1–CoREST complex docked with the nucleosome99 in a bipartite manner with the second SANT domain binding to DNA and the AOD and SWIRM domains binding an H3 tail bearing Lys methylation. LSD1 is shown in green and CoREST in red. Adapted from REF. 99. b | A model of the PHD–bromodomain module of BPTF (green) binding a nucleosome with modifications in the tails of two different histones, H3K4me3 and H4ac (the precise site is unknown but H4K16ac is modelled here). The remaining portion of the NURF complex is shown as green ovals, including the N terminus of BPTF, SNF2L and RBBP4 and -7. In both panels, core histones are pink with tail cartoons in dark blue. The modification recognition epitope is shown in space-filling spheres (carbon, yellow; nitrogen, blue; oxygen, red) with DNA in grey. AOD, amine oxidase domain; BPTF, bromodomain PHD finger transcription factor; Bromo, bromodomain; CoREST, corepressor to the RE1 silencing transcription factor; LSD1, Lys-specific demethylase-1; NURF, nucleosome remodelling factor; PHD, plant homeodomain; RBBP, retinoblastoma binding protein; SNF2L, sucrose non-fermenting-2-like ATPase.