
Figure 2. Structure-activity relationship (SAR) analysis of “harmalogs” on beta cell proliferation.
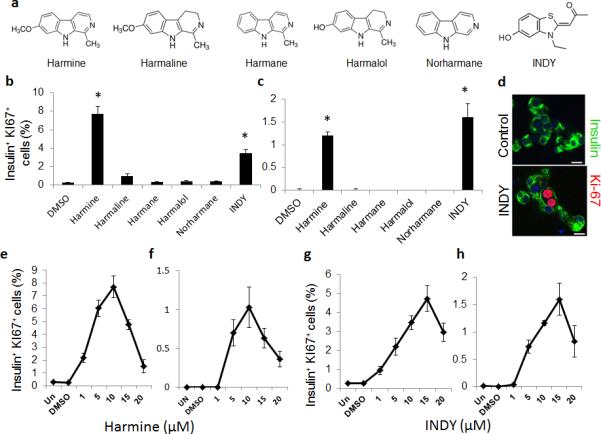
(a) Chemical structures of structural or functional harmine analogues (“harmalogs”). (b) and (c) Quantification of Ki67 labeling in rat (b) and human (c) beta cells in response to harmalogs. (d) An example of a Ki67+ “doublet” induced by INDY. The scale bar indicates 10 μm. (e−h) Dose-response curves for harmine and INDY in rat (e & g) and human (f & h) beta cell Ki67 labeling. In all relevant panels, error bars indicate s.e.m.; * indicates P<0.05 as determined by Wilcoxon Rank test. A minimum of 1000 beta cells was counted from four rat or four human donors for each graph. The scale bar indicates 10 μm.