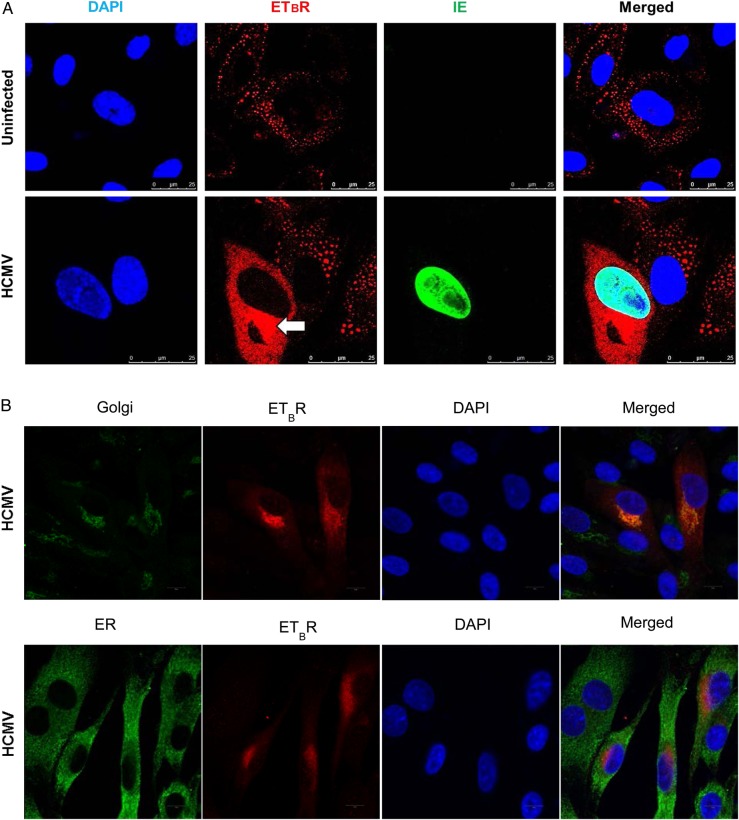
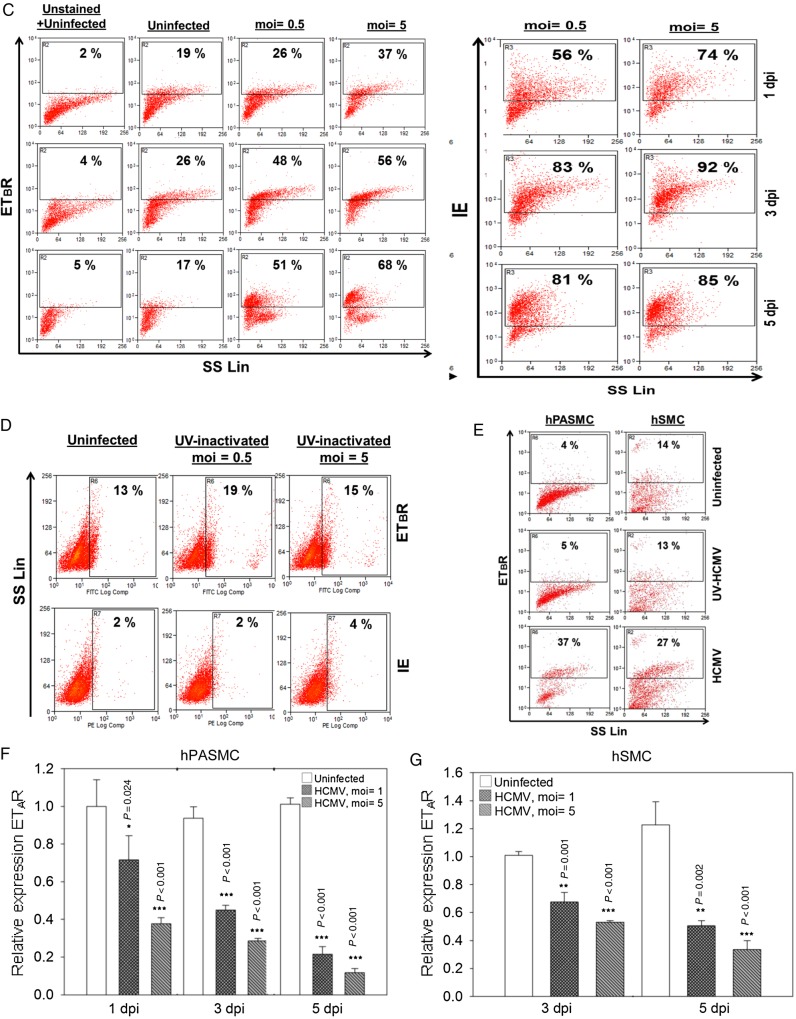
Figure 3.
Human cytomegalovirus (HCMV) infection alters endothelin receptor type B (ETBR) cellular distribution, induces surface expression of ETBR and its effect on endothelin receptor type A (ETAR). (A) Representative immunofluorescence staining on HCMV-infected endothelial cells at 3 days postinfection to illustrate the subcellular distribution of ETBR in uninfected and infected cells. Arrow shows increased ETBR protein expression in the perinuclear region. Nucleus was stained with 4′-6-diamidino-2-phenylindole ([DAPI] blue), and the immunoreactivity of ETBR or HCMV immediate-early (IE) was revealed with Alexa Fluor 594 (red) or Alexa Fluor 488 (green), respectively (biological replicates, n = 3). (B) Representative immunofluorescence staining of ETBR and giantin, a Golgi marker (top panel), or PDI, an endoplasmic reticulum marker (bottom panel). Nucleus was stained with DAPI (blue). Flow cytometry analysis on the effects of HCMV-infected endothelial cells (human umbilical vein cells [HUVECs]) or smooth muscle cells (SMCs) (human pulmonary arterial SMCs [hPASMCs] and human aortic SMCs [hSMCs]) on ETBR at indicated days postinfection (dpi). (C) The effects of different multiplicity of infection (moi) of HCMV on ETBR surface expression at 1, 3, and 5 dpi (left panel) in HUVECs. The HCMV IE is shown on the right panel. Y-axis denotes log intensity of ETBR (left panel) or IE (right panel), whereas x-axis is side scatter in linear scale (SS Lin). (D) The effects of ultraviolet (UV)-irradiated HCMV on ETBR surface expression in HUVECs. Little or no IE was detected with the UV treatment (bottom row). (E) The effects of UV-irradiated HCMV (middle row) or HCMV (bottom row) on ETBR surface expression in SMCs, hPASMCs (left column) and hSMCs (right column) at 5 dpi. Y-axis denotes log intensity of ETBR (left panel), whereas x-axis is SS Lin. The effects of HCMV on ETAR mRNA level in smooth muscle cells, hPASMC (F) and hSMC (G) (MOI; biological replicates, n = 3 with technical duplicates for each polymerase chain reaction; values are mean ± standard deviation; P < .05 was considered to be statistically significant; *P = .01–.05; **P = .001–.01; ***P < .001).


