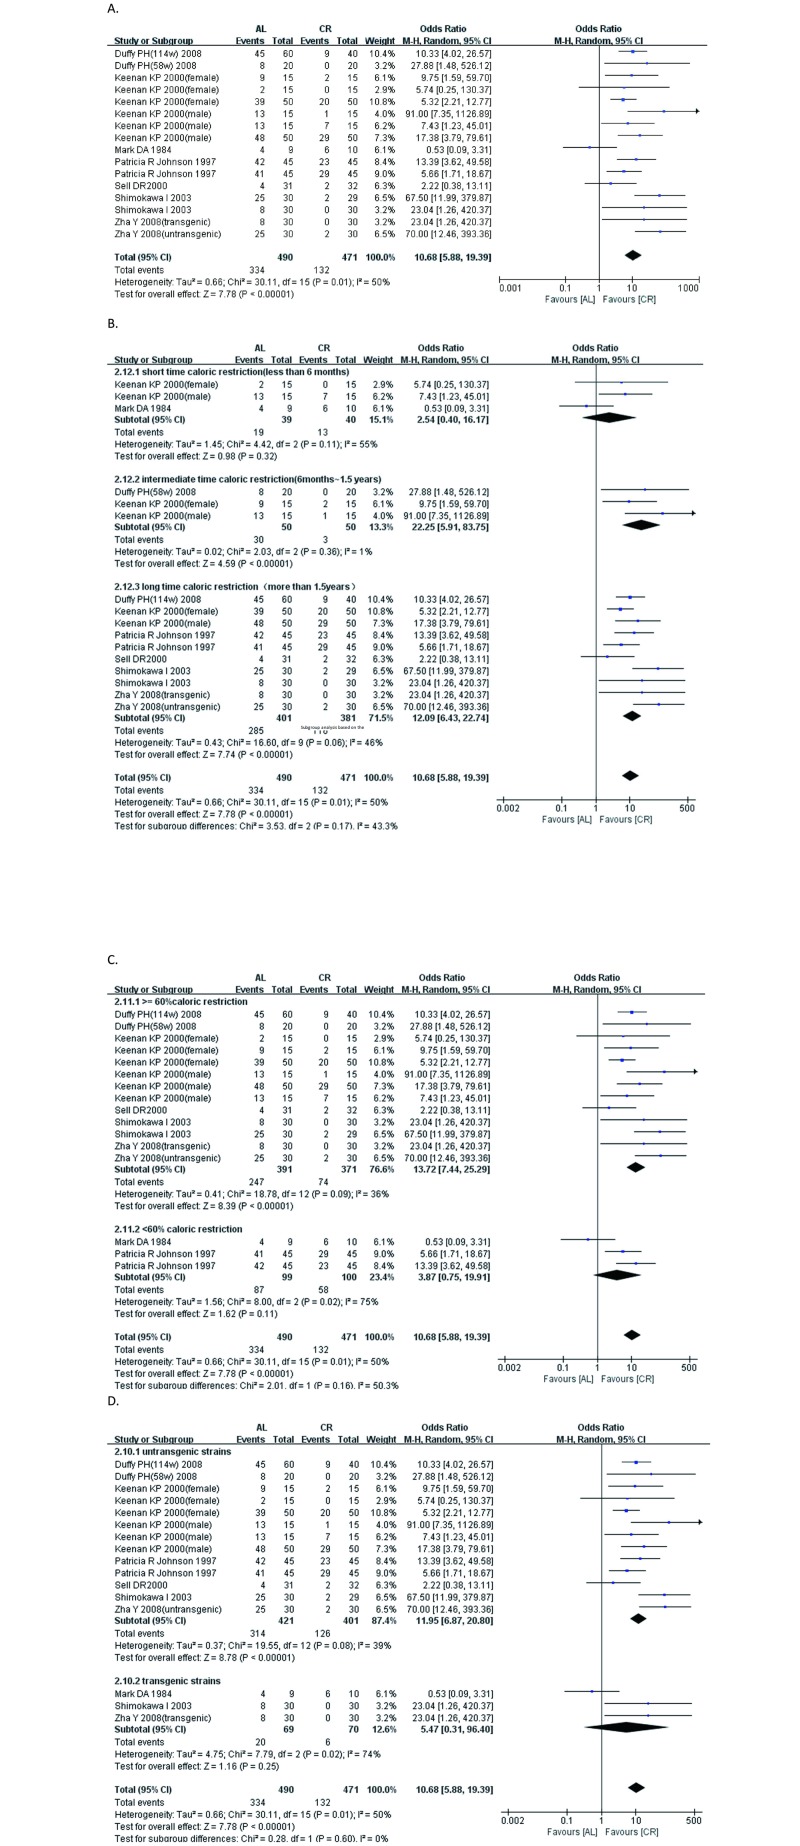
Fig 5. Forest plot comparing the incidence of nephropathy in the ad libitum—fed group and the caloric restriction group.
■, OR (odds ratios) of each study; horizontal lines represent the 95% CIs for the data; ◆, combined overall effect. (A) The effectiveness of the caloric restriction on the incidence of nephropathy. (B) Subgroup analysis based on the intervention duration. (C) Subgroup analysis based on the percentage of caloric restriction. (D) Subgroup analysis based on whether genetically modified model or not.

