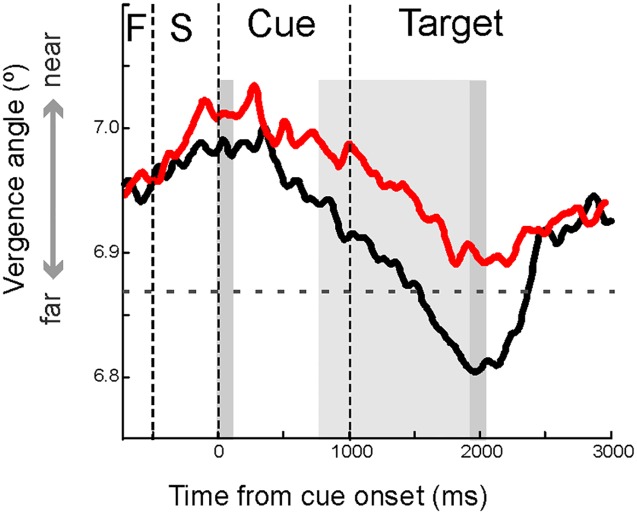
Fig 2. Average modulation across all conditions (cue and no-cue) of the angle of vergence during the time of a trial.
Black/red trace denotes average angle of eye vergence from control/ADHD subjects. The grey shaded bars indicate the time periods for data analysis as explained in the main text. Phases in the task are demarcated by vertical dashed lines (F denotes fixation period and S the stimulus period). Horizontal dashed line indicates vergence angle belonging to the estimated screen distance.

