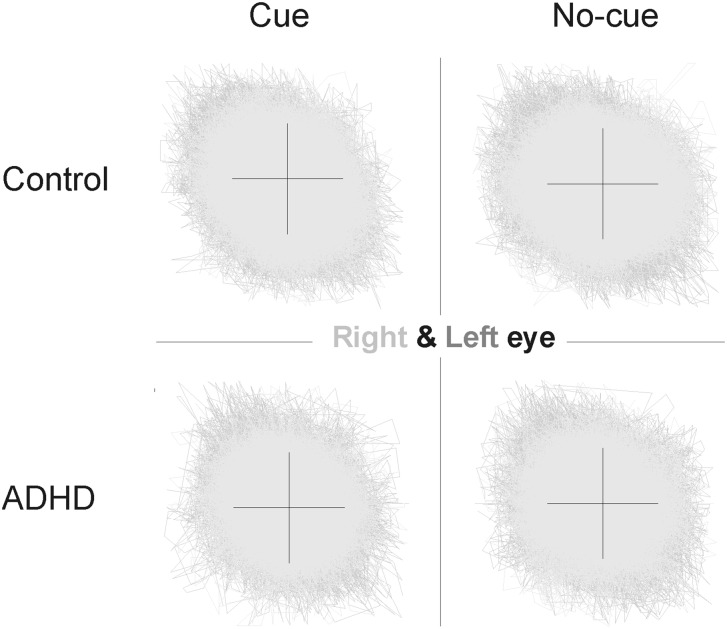
Fig 6. Eye positions of both eyes separately during the experiment.
Traces represent the eye positions of time from cue stimulus onset until 1000ms after target presentation. Cross represents the approximate size of the fixation cross. Right eye and left eye positions are plotted on top of each other in different shadings of grey.

