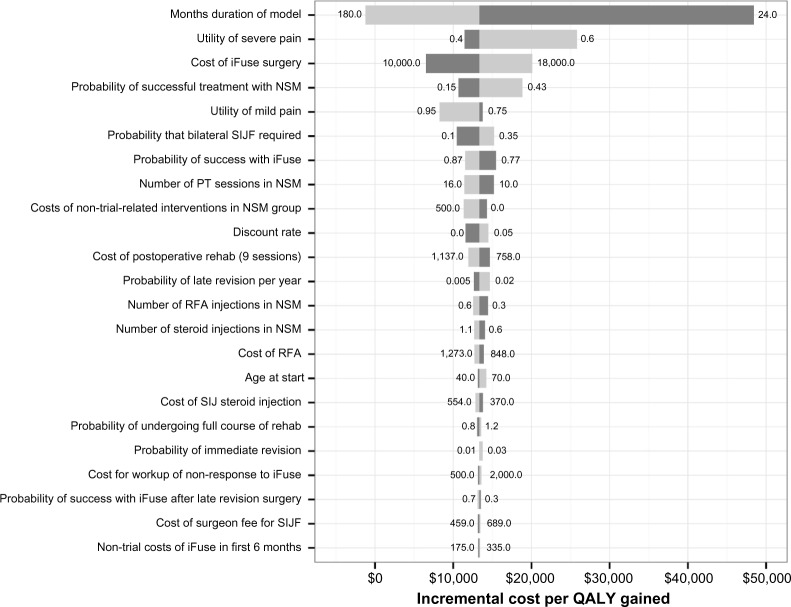
Figure 2.
Tornado diagram of incremental cost-effectiveness ratio (ICER).
Notes: Numbers for each bar show the low and high assumptions for each parameter. Light gray indicates the higher assumption has a higher ICER; dark gray indicates that the lower assumption has a higher ICER. Currency is presented as US dollars.
Abbreviations: SIJF, sacroiliac joint fusion; rehab, rehabilitation; RFA, radiofrequency ablation; mo, months; QALY, quality-adjusted life years; NSM, non-surgical management; PT, physical therapy.

