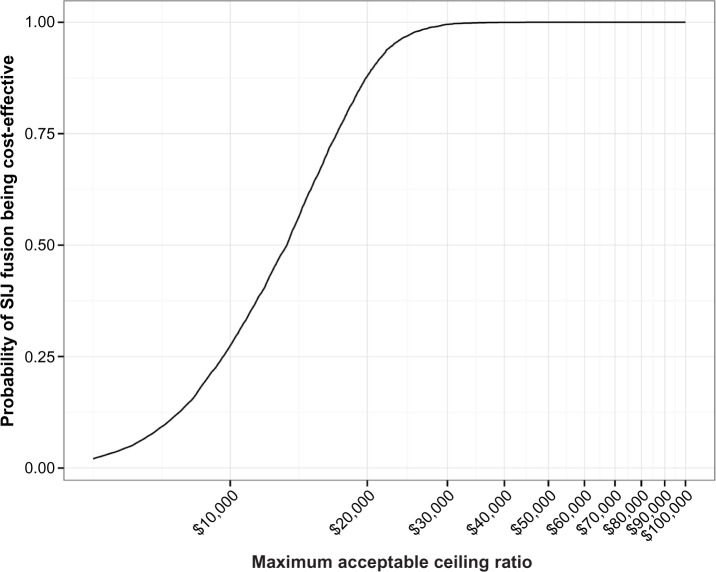
Figure 3.
Cost-effectiveness acceptability curve.
Notes: The x-axis shows a range of maximum acceptable ceiling ratios; the y-axis shows the probability that SIJ fusion is cost effective according to the selected maximum ratio. Currency is presented as US dollars.
Abbreviation: SIJ, sacroiliac joint.

