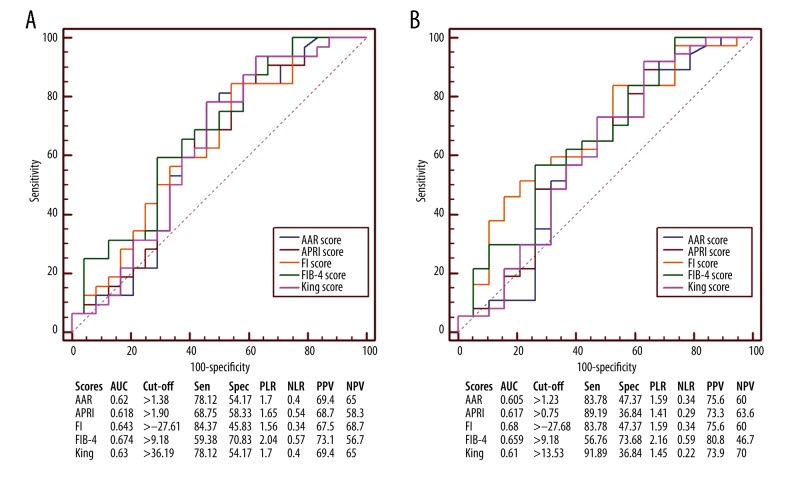
Figure 4.
Receiver operating characteristic curves showing the diagnostic accuracy of APRI, AAR, FIB-4, FI, and King scores in predicting the presence of varices in liver cirrhosis without UGIB at Child-Pugh classes B and C. (A) Prediction of moderate-severe varices. (B) Prediction of varices. AUC – area under curve; PLR – positive likelihood ratio; PPV – positive predictive value; NLR – negative likelihood ratio; NPV – negative predictive value; Sen – sensitivity; Spec – specificity.

