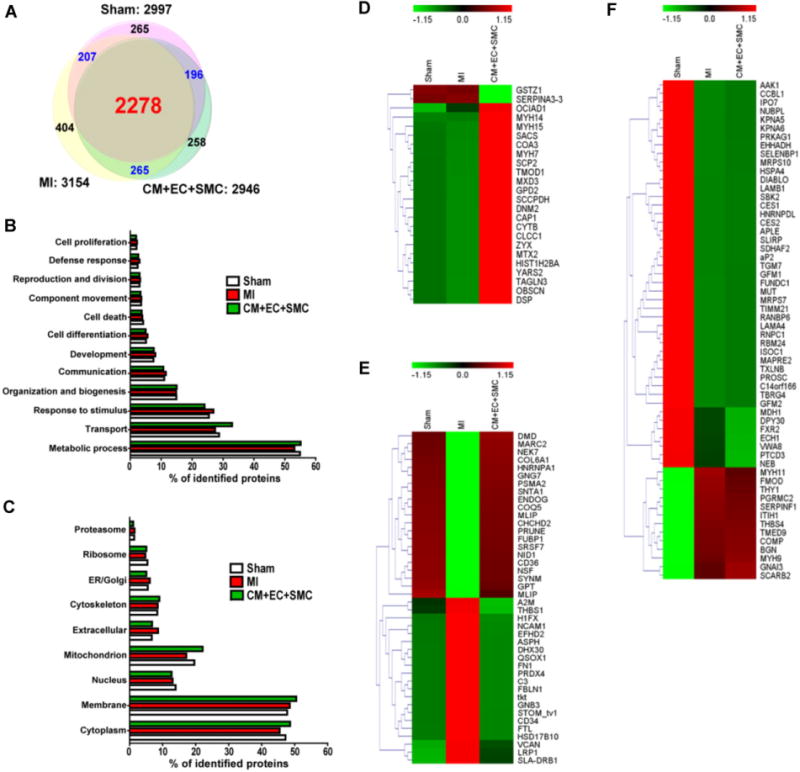
Figure 1.

Global protein profiling of myocardium from the Sham, MI, and CM+EC+SMC groups. (A) Venn diagram showing the number of identified proteins in the Sham, MI, and CM+EC+SMC groups. GO analysis of (B) biological processes and (C) subcellular localizations of the identified proteins. (D–F) Heat maps of three distinct categories of proteins whose expression levels were altered among Sham, MI, and CM+EC+SMC groups. The heat map scale is based on Z scores (Supporting Information) ranges from −1.15 (green) to 1.15 (red) with a midpoint of 0 (black). (D) Category 1: no change in MI but altered after trilineage cell transplantation. (E) Category 2: altered in MI but reversed by trilineage cell transplantation; (F) Category 3: altered in MI but not reversed by trilineage cell transplantation.
