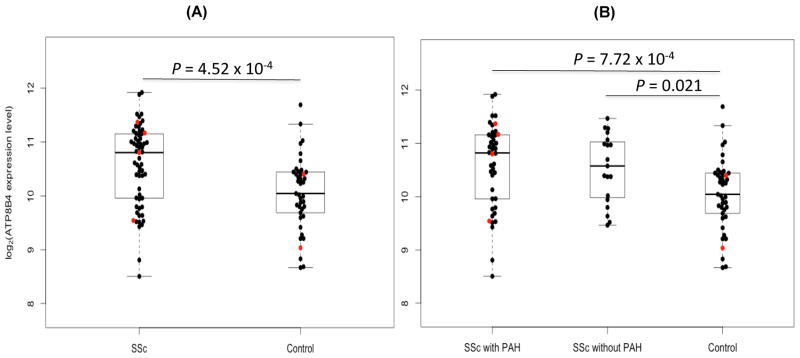
Figure 2.
Overexpression of ATP8B4 mRNA in peripheral blood mononuclear cell of scleroderma patients. Box and whisker plots of ATP8B4 (ILMN_1783956) expression values: (A) comparing the combined SSc-PAH− (n=19) and SSc-PAH+ (n=42) patients to corresponding controls (n=41) (P = 4.52 × 10⁻⁴), and (B) comparing either the SSc-PAH− or SSc-PAH+ group to the controls separately (P = 0.021 and 7.72 × 10⁻⁴, respectively). Boxes represent the interquartile range (IQR) and the horizontal lines are the medians. Whiskers represent the closest values within 1.5 times the IQR. The sample values for the 4 cases and 2 controls known to have the GC genotype are colored in red.

