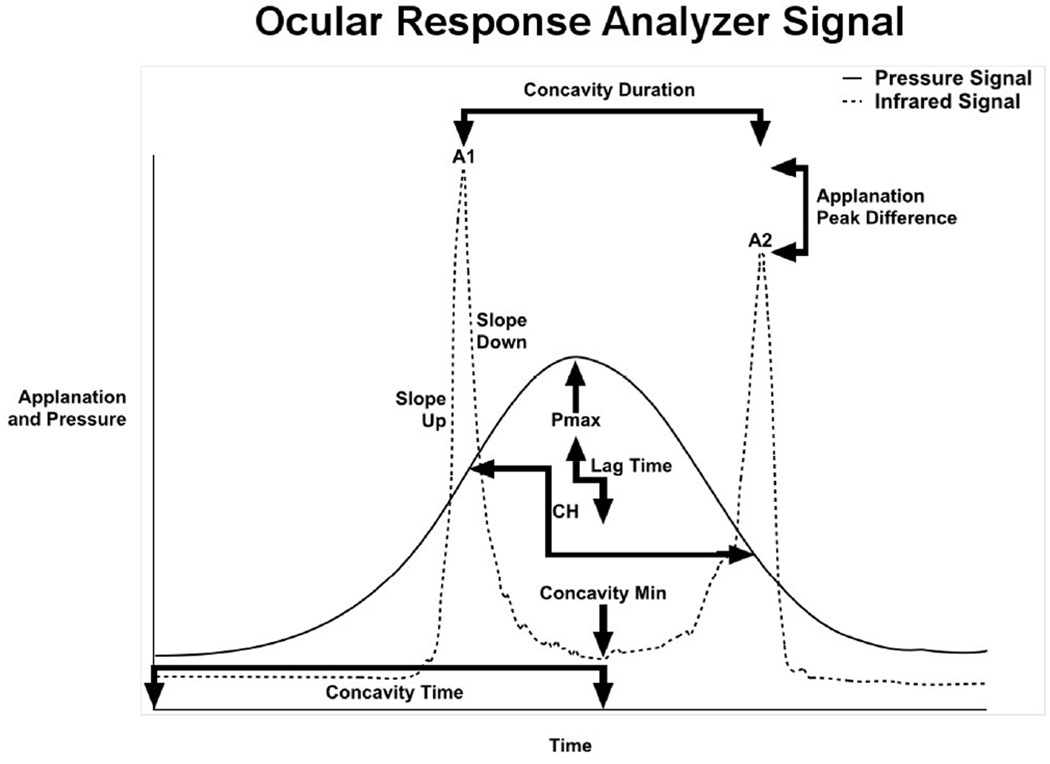
Figure 1.
Graphical representation of selected Ocular Response Analyzer (ORA) signal output: The solid line depicts the pressure applied to the cornea, and dotted line depicts the reflection of infrared light off the cornea surface. Variabled are derived from aspects of the standard ORA waveform as shown here. Abbreviations: A1 is peak intensity at first applanation event; A2 is peak intensity at second applanation event; Pmax ia peak pressure applied, CH is corneal hysteresis.

