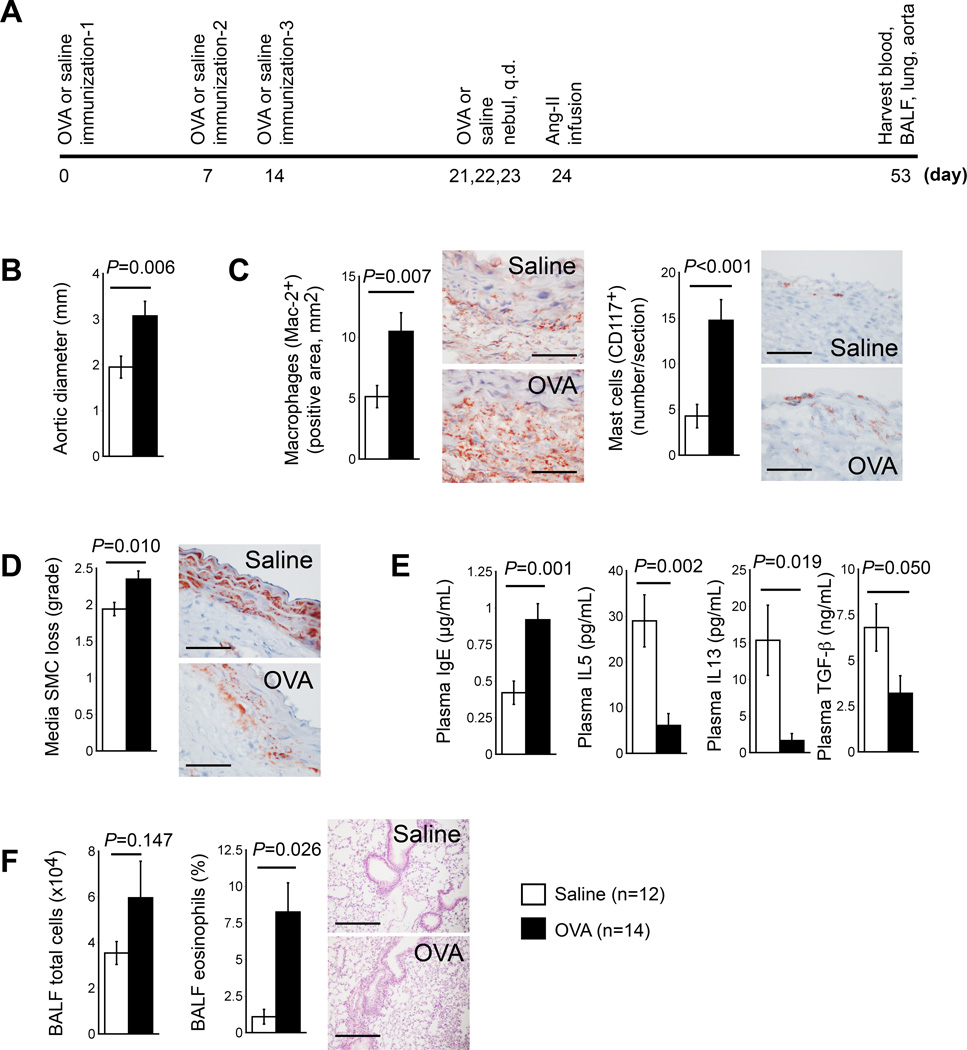
Figure 2.
OVA-induced ALI increases AAA formation in Apoe−/− mice. A. Experimental protocol. B. Aortic diameters at harvest. C. AAA lesion content of macrophages and mast cells. D. AAA lesion SMC loss in grade. Representative data for panels C and D are shown to the right, Scale bar: 50 µm. E. Plasma levels of IgE, IL5, IL13, and TGF-β. F. BALF total inflammatory cell number and eosinophil percentage. Representative lung histology data (H&E staining) are shown to the right, scale bar: 200 µm.

