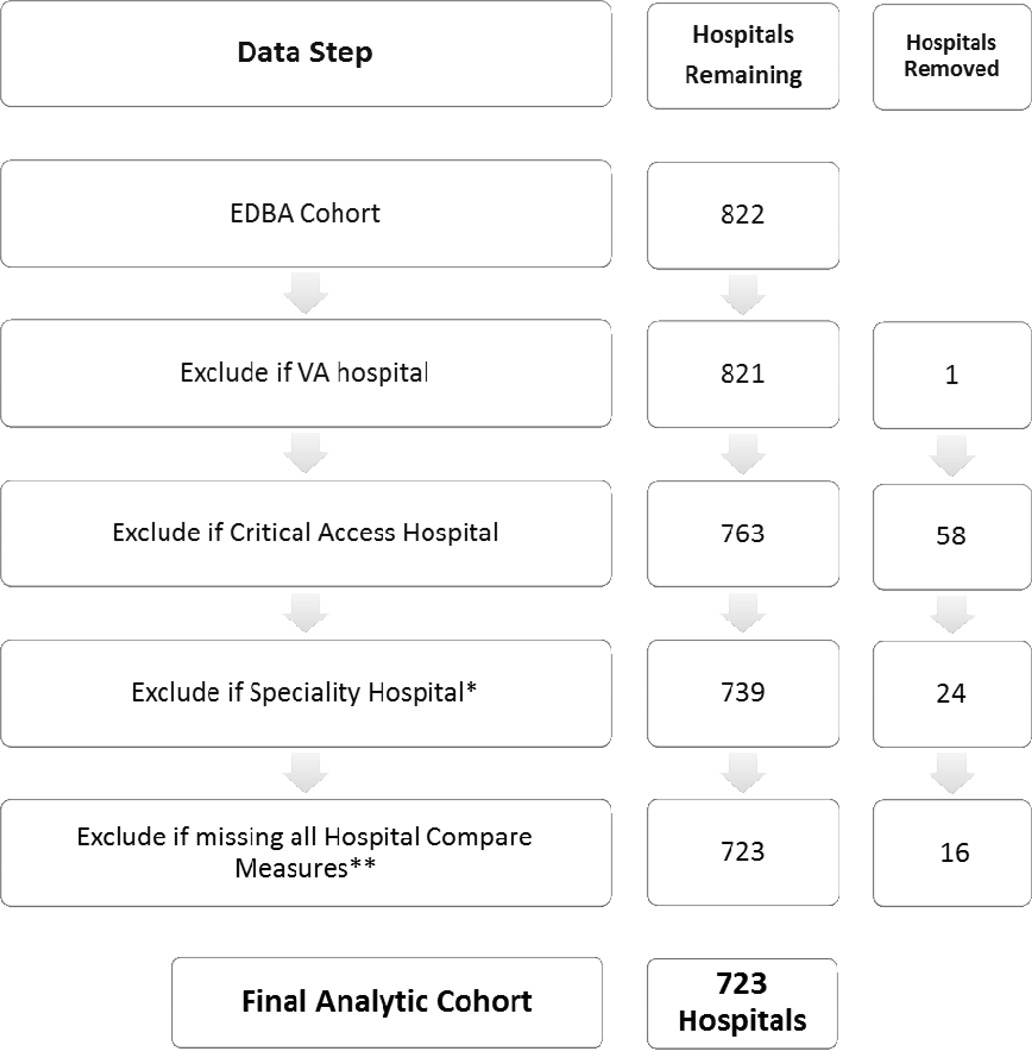
Figure 1.
Sample Flowchart
*Includes Surgical (n=1), Psychiatric (n=1), Heart (n=4), Obstetrics and Gynecology (n=2), Rehabilitation (n=3), Children’s (n=5), Acute Long-Term Care(n=7) and Other Specialty Treatment(n=1) Hospitals.
**Measures are ED1B (LOS, admitted), ED2B (boarding time), OP18(LOS, discharged),OP20(wait time). The number of hospitals reporting to CMS Hospital Compare: ED1B- 3,019; ED2B- 3,019; OP18- 2,928; OP20-2,933.

