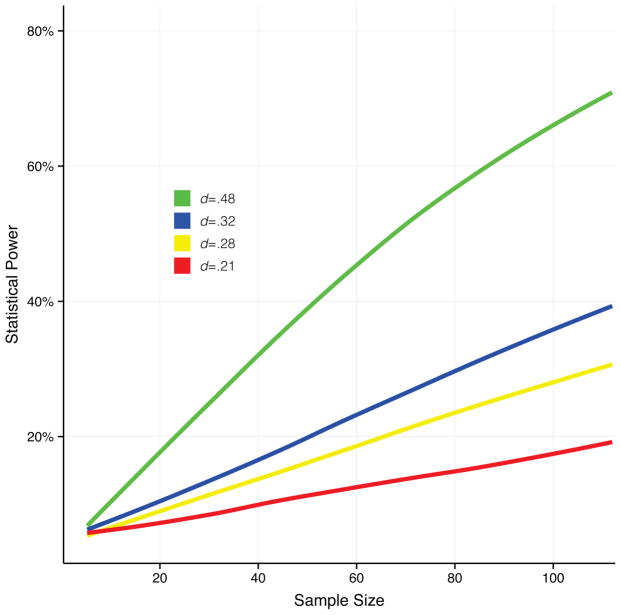
Figure 1. Statistical power as a function of effect size and sample size.
The figure shows the relationship between sample size and statistical power for four different effect sizes. Power calculations were performed using simulations in R (3.1.1). In the simulations, half of the sample was drawn from a standard normal distribution and the other half from a second normal distribution with a mean representing the investigated effect size. This procedure was repeated 1000 times per effect size and sample size. Power was determined as the proportion of these 1000 “experiments” rejecting the null hypothesis (using one-way ANOVA), with the alpha level set to 0.05. The effects sizes presented in the figure represent the largest (d=.48) and smallest (d=.21) effects sizes within the field of intranasal oxytocin studies in humans, as well as the mean effect size for healthy subjects (d=.28) and clinical trials (d=.32). It is clear that the studies within this field are underpowered since for all effect sizes and sample sizes the statistical power is below 80%, the standard for minimal adequate statistical power.

