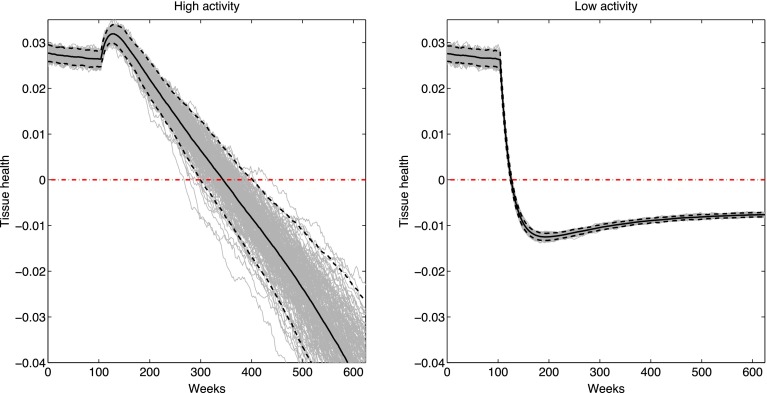
Figure 6.
Cartilage health (as defined in the text) during an abrupt shift from medium to high activity (left) or from medium to low activity (right). Grey lines are individual activity realizations; solid black lines are the means over all realizations, with 95% confidence intervals in dashed black lines. Red dash-dotted line indicates the zero health OA danger threshold.

