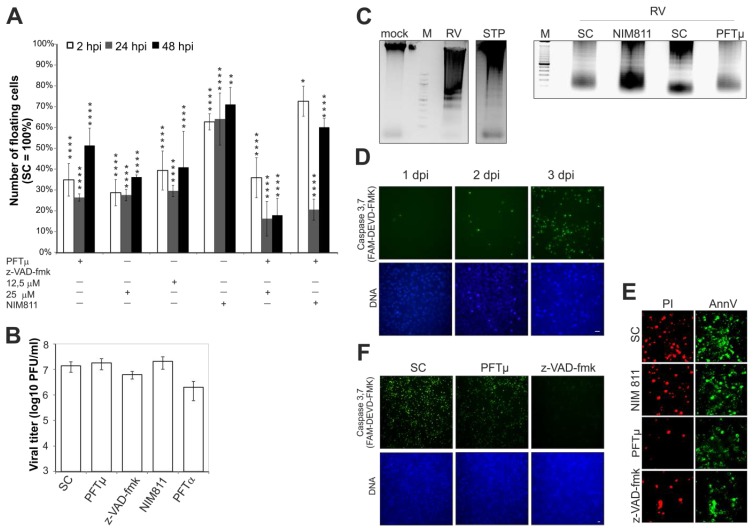
Figure 1.
Analysis of selected pharmacological inhibitors (z-VAD-fmk (12.5 μM if not otherwise indicated), PFTμ and α (12.5 μM), and NIM811 (2 μM)) with respect to RV replication and cytopathic effect (CPE) induction. (A) Effect of different application time points on the presence of floaters in the supernatant of RV-infected Vero cells at 3 dpi. The respective SC (DMSO)-treated sample was set at 100%; (B) RV titer was determined by plaque assay for supernatants collected at 3 dpi after drug application at the time point with maximal efficacy (NIM811 at 2 hpi, z-VAD-FMK and PFTμ at 24 hpi). PFT α was added at 2 hpi. In comparison to the SC, changes in viral titer were not significant; (C) Characterization of the presence of an apoptotic laddering in the floater population collected from the supernatant of the SC- and NIM811 (2 hpi)- and PFTμ (24 hpi)-treated and RV-infected Vero cells. Floaters were collected at 3 dpi and then counted before the same number of floaters (1 × 10⁶) was subjected to DNA extraction and analysis by agarose gel electrophoresis. As a control, mock- and staurosporine (5 μM)-treated Vero cells are shown in comparison to the floater population (3 dpi) of RV-infected cells. M, molecular size marker; (D) Time course analysis (1, 2, 3 dpi) of the activation of caspase 3 and 7 in RV-infected Vero cells; (E) Analysis of necrotic (Propidium iodide (PI)-positive) and early (annexin V-enhanced green fluorescent protein (EGFP)-positive) and late-apoptotic events (annexin V-enhanced green fluorescent protein (EGFP) and PI-positive) by annexin V-EGFP and PI staining by microscopic analysis of living cells; (F) Determination of caspase 3 and 7 activity after application of PFTμ and NIM811 in comparison to the SC. SC, solvent control; scale bar, 20 μm. * p < 0.05, ** p < 0.01, *** p < 0.001, **** p < 0.0001.

