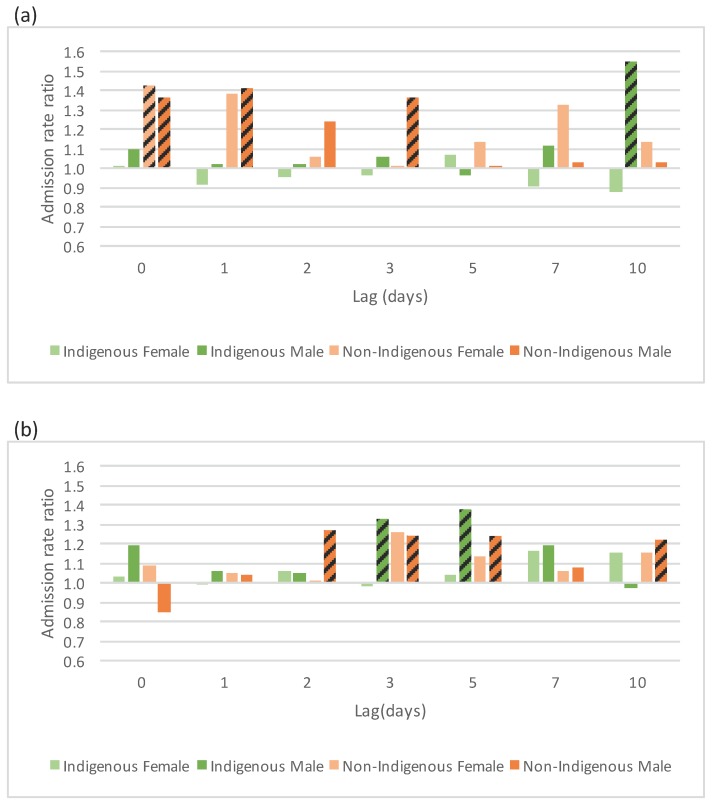
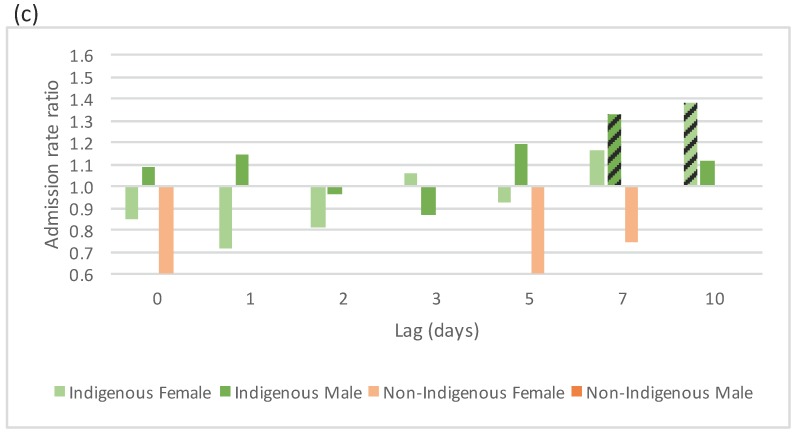
Figure 4.
Selected cold effects on acute respiratory admissions, expressed as rate ratios, by Indigenous status and sex over lags of 0 to 10 days. (a) Cold effects, defined by Tmin, on residents aged 0–9 in the Top End climate zone; (b) cold effects, defined by Tmax, on residents aged 35+ in the Top End climate zone; (c) cold effects, defined by Tmin, on residents aged 0–9 in the Central Australia climate zone. Effects that are statistically significant at the five per cent significance level are highlighted with a diagonal line.


