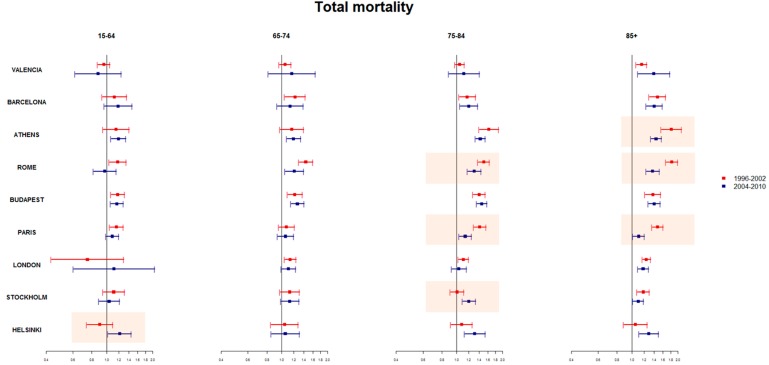
Figure 3.
Estimated RRs (95% CI) for high temperatures and all cause daily mortality by age groups between the 75th and 99th percentile of mean temperature in the periods before 2003 (Period 1) (red line) and after 2003 (Period 2) (blue line). Nine European cities, 1996–2010. * orange boxes: significant REM index P1 and P2 effect estimate; Athens analyses by age group P1 = 1999–2002.

