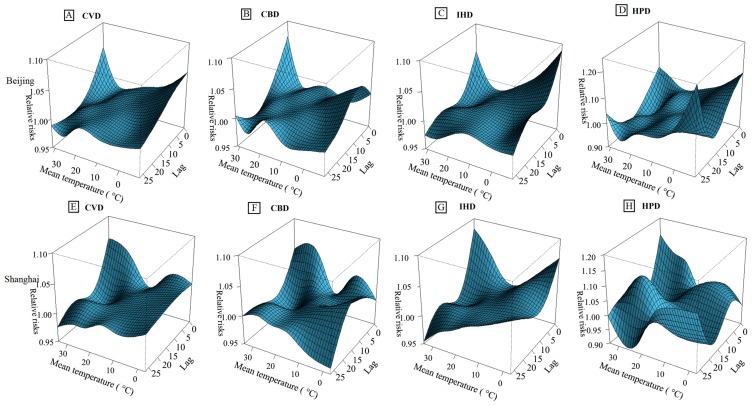
Figure 1.
Three-dimensional graph of the relative risks for cause-specific cardiovascular mortality by temperature (°C) and lag days in Beijing and Shanghai, China, during 2007–2009. (A–D) The relative risks for mortality of CVD, CBD, IHD and HPD in Beijing, respectively; (E–H) The relative risks for mortality of CVD, CBD, IHD and HPD in Shanghai, respectively. The relative risks used five degrees of freedom for temperature and four degrees of freedom for lag up to 27 days. The reference temperatures were 13.6 °C for Beijing and 17.7 °C for Shanghai, respectively.

