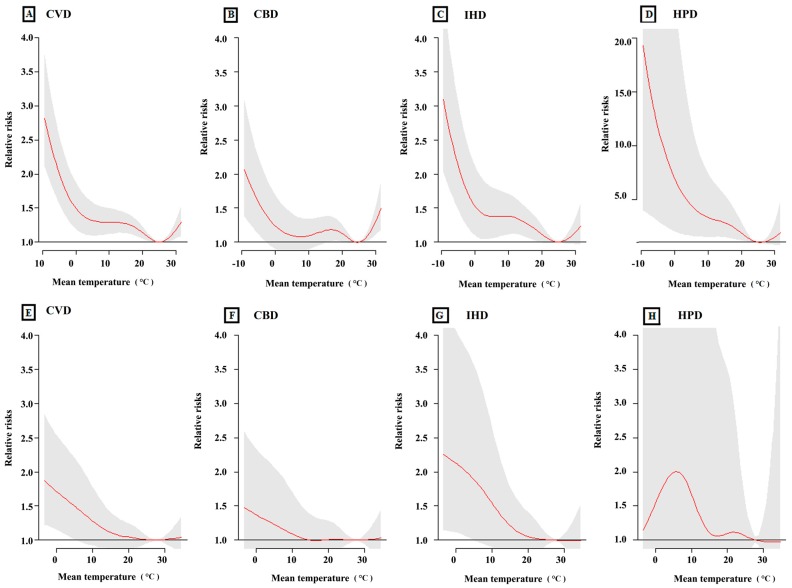
Figure 2.
The relationship between mean temperature and cause-specific cardiovascular mortality over lag 0–27 days in Beijing and Shanghai, China, during 2007–2009. (A–D) The relationship between mean temperature and CVD, CBD, IHD and HPD in Beijing, respectively; (E–H) The relationship between mean temperature and CVD, CBD, IHD and HPD in Shanghai, respectively. The maximum likelihood estimate of relative risks is shown as smooth red lines, and the point-wise 95% confidence intervals are shown in the gray regions.

