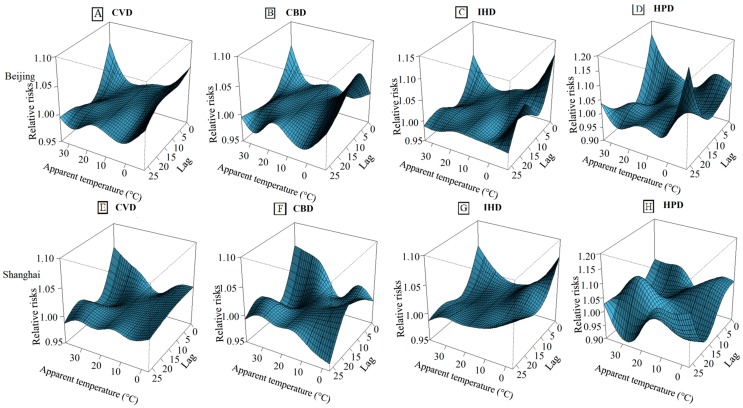
Figure A3.
Three-dimensional graph of the relative risks for cause-specific cardiovascular disease by apparent temperature (°C) and lag days during 2007 and 2009 in Beijing and Shanghai, China. (A–D) The relative risks for CVD, CBD, IHD and HPD mortality in Beijing, respectively; (E–H) The relative risks for mortality from CVD, CBD, IHD and HPD mortality in Shanghai, respectively.

