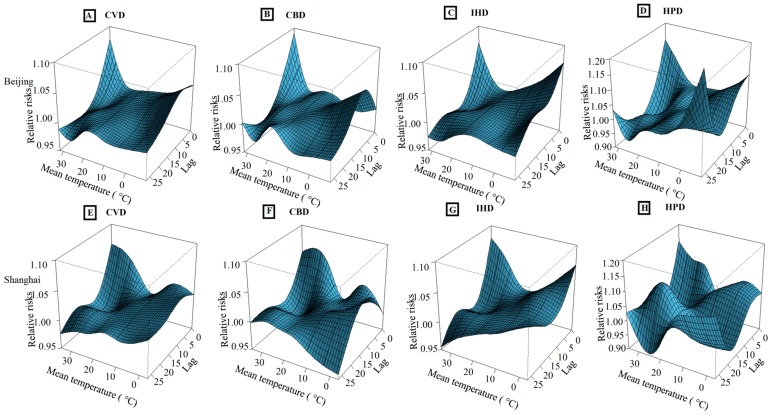
Figure A4.
Three-dimensional graph of the relative risks for cause specific cardiovascular disease by mean temperature (°C) and lag days during 2007 and 2009 in Beijing and Shanghai, China (excluding the air pollution in the model)*. Note: * the effects of temperature on mortality from cardiovascular and cerebrovascular disease in two cities were excluded the influences of air pollution. The reference temperatures were 13.6 °C for Beijing and 17.7 °C for Shanghai, respectively; (A–D) represent the relative risks for mortality from CVD, CBD, IHD and HPD in Beijing, respectively; (E–H) represent the relative risks for mortality from CVD, CBD, IHD and HPD in Shanghai, respectively.

