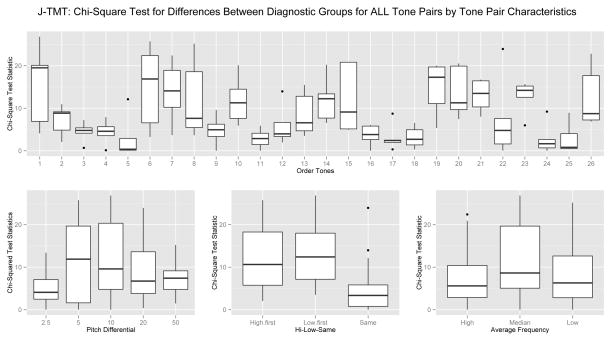
Figure 3.
J-TMT: Chi-Square Test for Differences Between Diagnostic Groups for ALL Tone Pairs by Tone Pair Characteristics
J-TMT: Box-plots of the 130 χ2 test statistics testing for independence between correct response and diagnosis by item characteristics: by PD (bottom left panel), by order of tones within a pair (bottom middle panel), by average pitch of the two tones in a pair (bottom right panel) and by sequence number of a tone-pair within each PD (top panel). Each box represents the interquartile range, the horizontal line within the box represents the median, and the points beyond the whiskers represent the outliers for the set of χ2(1) test statistics for all items at the given level of the characteristic. Note, since identical tones are necessary for the J-TMT, only the tone-pairs from categories ‘lower-first’ and ‘higher-first’ were included in the test assessing the effect of the characteristic on the ability of items to differentiate between SZ and HC. Note, that the critical α=0.05 value for a test for independence is χ2(1)=3.84.

