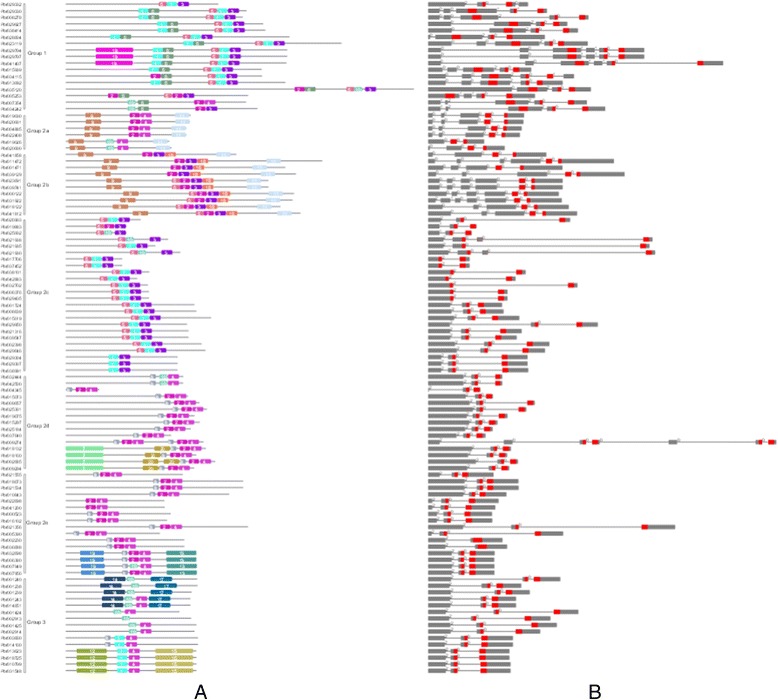
Fig. 3.

Schematic representations of the conserved motifs and exon–intron compositions. Names of genes are indicated on the left. a Conserved motifs in WRKY proteins. Different motifs are highlighted with different colored boxes with numbers 1 to 20. Lines represent protein regions without detected motif. b Exon–intron compositions in WRKY gene. Exons, represented by gray or red boxes, are drawn to scale. Dashed lines connecting two exons represent an intron. WRKY domain is marked in red
