Figure 5.
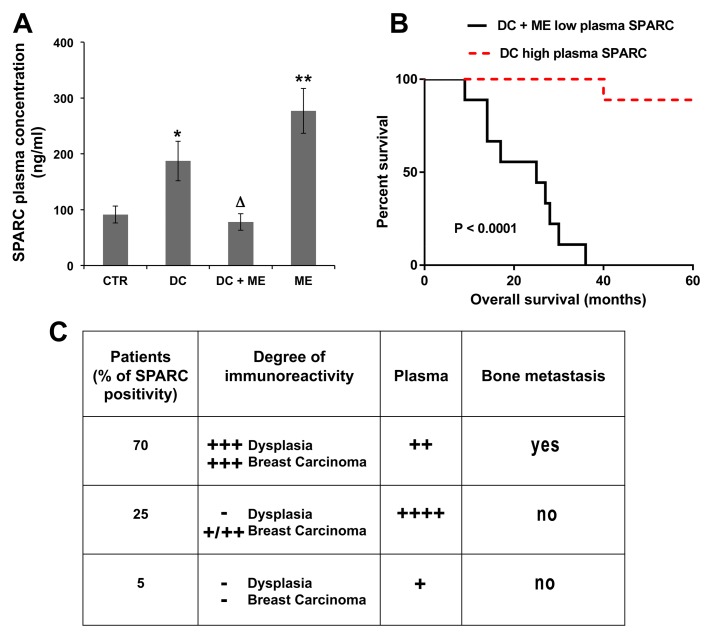
Plasma levels of SPARC and predictivity of bone metastasis. (A) ELISA assay was performed using the plasma samples from control (CTR), ductal carcinoma-bearing patients (DC), with or without bone metastasis (ME). The data are the means ± S.E. of nine samples, assayed in triplicate; * p < 0.05 and ** p < 0.005 versus CTR; Δ p < 0.05 versus DC; (B) Survival curve on Kaplan-Meier plots of the data from breast carcinoma patients with or without bone metastasis development; and (C) The Table shows the percentage of positivity for SPARC at the degree indicated (second column); the plasma value score was also shown (third column), and the relationship with bone metastasis formation is indicated (fourth column). − (negative signal); + (weak signal); ++ (moderate signal); +++ (strong signal); ++++ (very strong signal).

