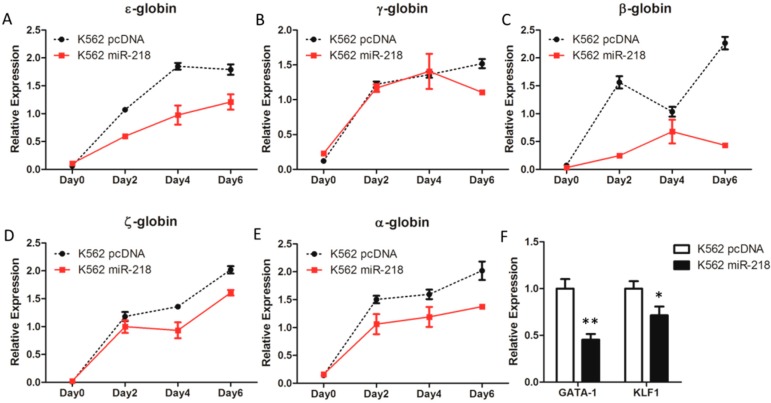
Figure 6.
The relative mRNA expression of ε-globin (A), γ-globin (B), β-globin (C), ζ-globin, (D) and α-globin (E) gene during hemin-induced erythroid differentiation of K562 pcDNA and K562 miR-218 cells was determined using quantitative real-time PCR; (F) The expression of GATA-1 and KLF1 in K562 pcDNA and K562 miR-218 cells were also identified by quantitative real-time PCR. All relative mRNA expression using quantitative real-time PCR was normalized to GAPDH and β-actin. Asterisks indicate that differences between samples were statistically significant according to an independent-sample t-test, * p < 0.05, ** p < 0.01.

