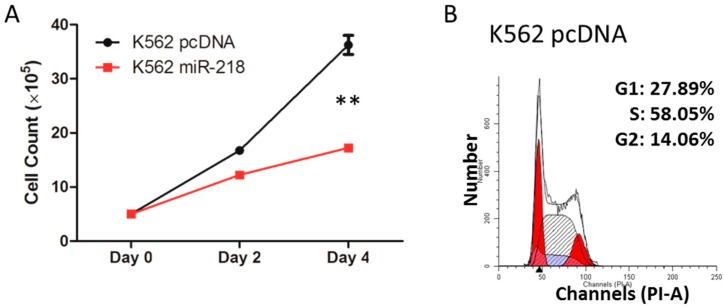
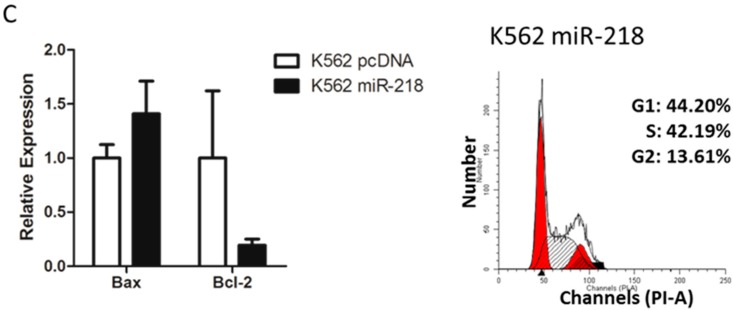
Figure 7.
(A) Growth curve of control and K562 miR-218 cells. Cells were counted every two days. Asterisks indicate that differences between samples were statistically significant according to an independent-sample t-test, ** p < 0.01; (B) Cell-cycle assay of control and K562 miR-218 cells. Statistical percentages of each stage are shown; (C) Relative mRNA expression of BAX and Bcl-2 in control K562 cells and K562 cells overexpressing miR-218 using quantitative real-time PCR normalized to GAPDH.


