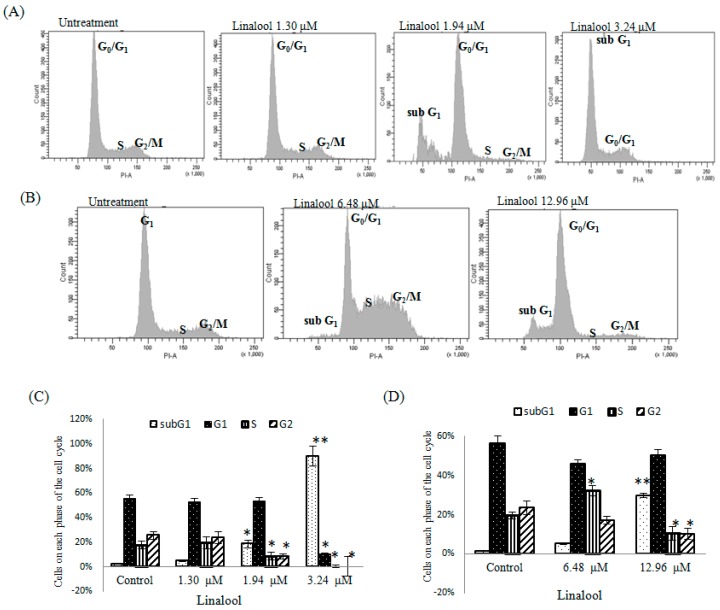
Figure 5.
Flow cytometry (FCM) was used to obtain the apoptosis rate (sub-G1) and cell cycle distribution (G0/G1, S, and G2/M). This figure shows the profile (A) and percentage (C) of 10,000 U937 cells reacting for 6 h after adding 1.30, 1.94, and 3.24 μM concentrations of linalool and the profile (B) and percentage (D) of 10,000 HeLa cells reacting for 6 h after adding 6.48 and 12.96 μM concentrations of linalool. Data are presented as mean ± SD for the three independent experiment results. * p < 0.05 and ** p < 0.001 against control (0.1% ethylalcohol), respectively.

