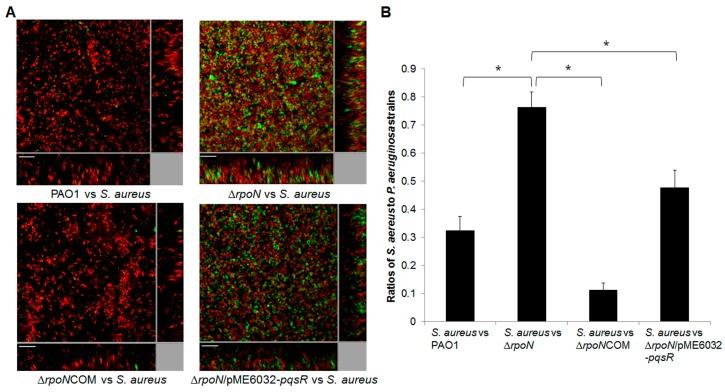
Figure 3.
(A) Images of biofilm co-cultures of S. aureus 15981/pSB2019 with (i) PAO1; (ii) ∆rpoN; (iii) ΔrpoNCOM and (iv) ΔrpoN/pME6032-pqsR, respectively. S. aureus 15981/pSB2019 appeared green due to GFP expression whereas P. aeruginosa strains were stained with red fluorescent dye CYTO62 used to generate the simulated 3D images (Bitplane, AG). Scale bar, 20 μm; (B) Biomass ratios of S. aureus to P. aeruginosa strains from different biofilm co-cultures were calculated using Imaris and shown in the histogram. Means and S.D. from triplicate experiments are shown. Student’s t-test was performed for testing differences between groups. * p ≤ 0.05.

