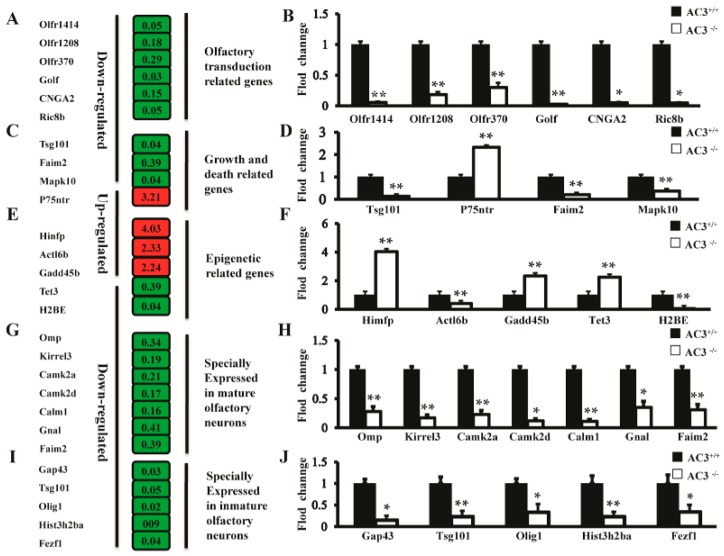
Figure 4.
Quantitative RT-PCR verification of the differentially expressed genes in the AC3−/− and AC3+/+ mice. (A) Differentially expressed genes associated with olfactory signal transduction function identified from the microarray results; (B) qRT-PCR verification of the differentially expressed genes associated with olfactory signal transduction; (C) Differentially expressed genes associated with cell growth and death identified from the microarray results; (D) qRT-PCR verification of the differentially expressed genes associated with cell growth and death; (E) Differentially expressed genes associated with epigenetic regulation function identified from the microarray results; (F) qRT-PCR verification of the differentially expressed genes associated with epigenetic regulation functions; (G) Differentially expressed genes specifically expressed in the mature olfactory neurons identified from the microarray results; (H) qRT-PCR verification of the differentially expressed genes specifically expressed in mature olfactory neurons; (I) Differentially expressed genes specifically expressed in the immature olfactory neurons identified from the microarray results; (J) qRT-PCR verification of the differentially expressed genes specifically expressed in immature olfactory neurons. Note: In the microarray result panel, green represents down-regulated genes and red represents up-regulated genes. The numbers in the red and green boxes represent fold change. n = 3 for each group of mice, experiments are in quadruplicates. All values are expressed as mean ± s.d. * p ≤ 0.05, ** p ≤ 0.01, ANOVA with Student’s t-test.

