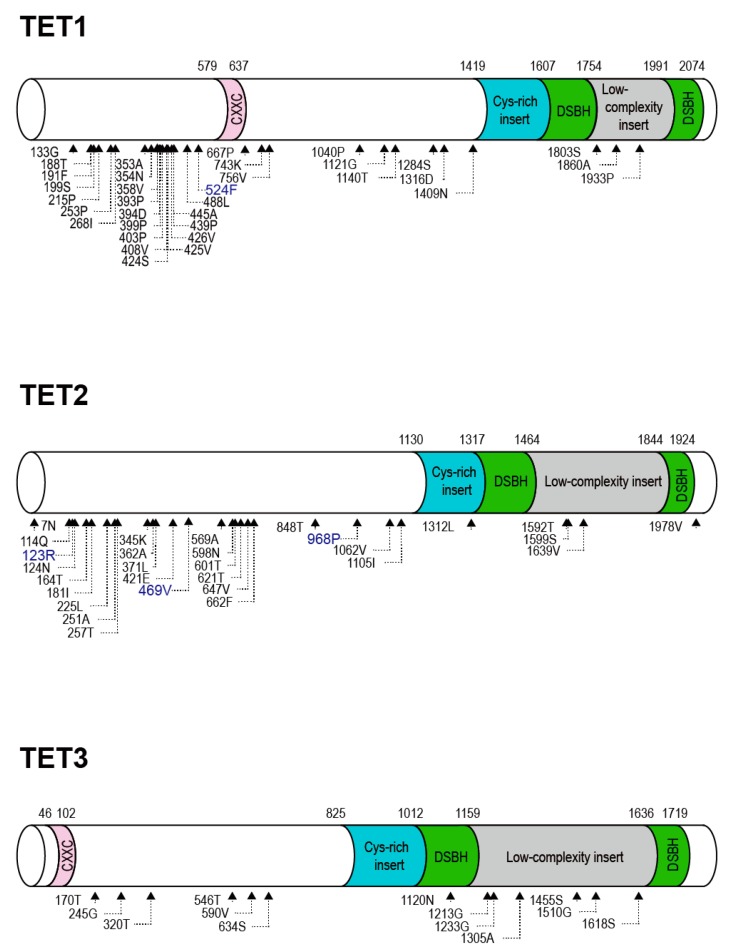
Figure 1.
Structural representation of positively selected codon sites in mammalian TET family genes. Based on the human TET gene structure, domain diagrams of TET1, TET2 and TET3 are shown with CXXC, Cys-rich insert, DSBH and low-complexity insert domains. The corresponding domain boundaries are shown with the amino acid number above the diagram. The triangles at the bottom represent sites of positive selection identified by at least three of the six analysis methods used. Amino acid sites detected by PAML using model M8 are highlighted in blue.

