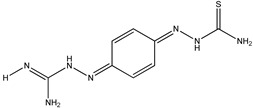
Table 1.
Details of the compounds tested in this study for the inhibition of mushroom tyrosinase.
| ID † | Chemical | 2D Structure | ZINC ID | Mw | IC50 (μM) | LE ‡ |
|---|---|---|---|---|---|---|
| 1 | Phenylthiourea (PTU) |  |
ZINC03875720 | 152 | 1 | 0.84 |
| 2 | Kojic acid |  |
ZINC13831818 | 142 | 29 | 0.64 |
| 3 | Thioacetazone |  |
ZINC17970372 | 236 | 14 | 0.43 |
| 4 | Ambazone |  |
ZINC18066619 | 237 | 15 | 0.42 |
| 5 | Methimazole |  |
ZINC01187543 | 114 | 94 | 0.81 |
| 6 | Carbimazole |  |
ZINC00001091 | 186 | >2000 | - |
| 7 | Thiouracil |  |
ZINC05127810 | 128 | 215 | 0.64 |
| 8 | Methylthiouracil |  |
ZINC05037820 | 142 | 266 | 0.56 |
| 9 | Propylthiouracil |  |
ZINC04640636 | 170 | 375 | 0.44 |
† All chemicals in following Table 2, Table 3 and Table 4 have the identical IDs to those in Table 1; MW and IC50 mean molecular weight and half maximal inhibitory concentration, respectively; ‡ LE indicates ligand efficiency that is defined as 1.4 × (−log10IC50)/N, where N is the number of non-hydrogen atoms [32].
