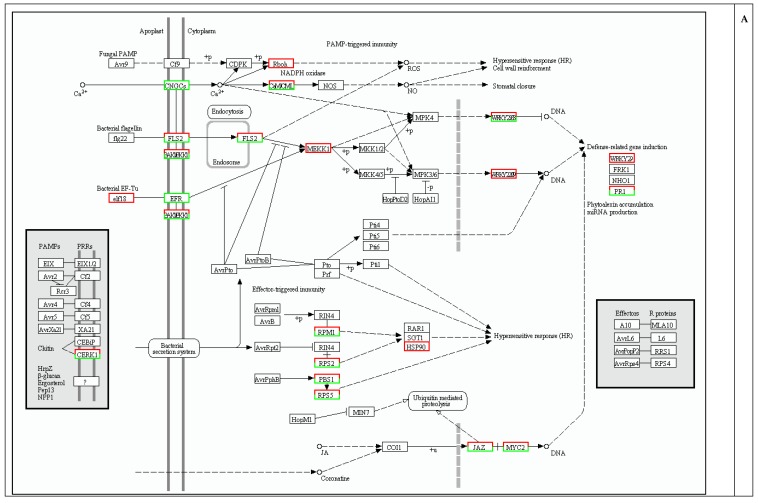
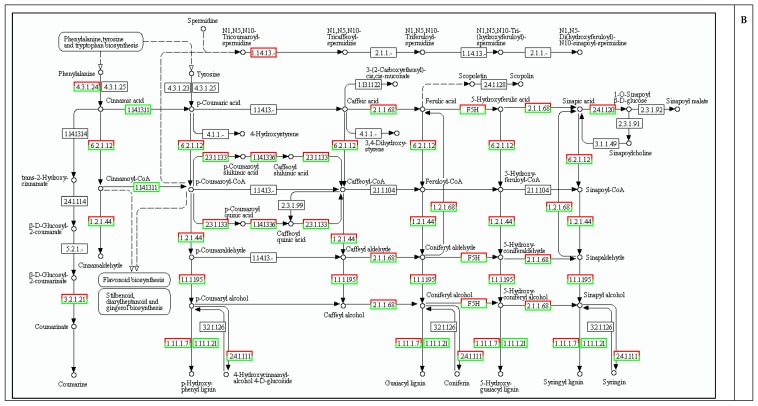
Figure 5.
Plant-pathogen interactions and phenylpropanoid biosynthesis pathways induced by sodium nitroprusside treatment (SNP, NO donor). Black borders: Pathway; Red represents up-regulated genes; Green represents up-regulated genes. (A) Plant-pathogen interaction; (B) Phenylpropanoid biosynthesis.


