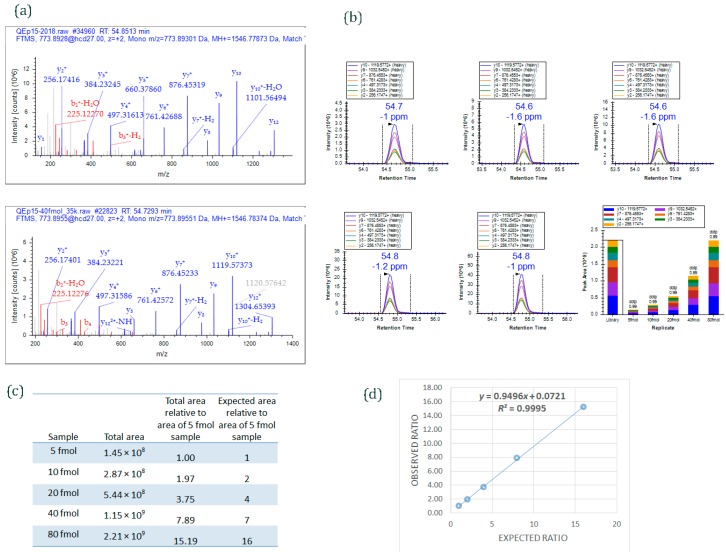
Figure 4.
An example of data acquired by PRM method. Different amounts of a 15-peptide PRTC mixture (5, 10, 20, 40, and 80 fmol) was spiked into 100 ng HeLa digest and analyzed by PRM. (a) MS/MS spectrum of the heavy isotope labeled-peptide ELGQSGVDTYLQTK* (m/z 773.8955, 2+) acquired using data-dependent acquisition (upper panel) and used as an spectral library to match MS/MS spectrum of the peptide acquired by PRM method (lower panel); (b) Graphs displaying chromatograms of fragment ions extracted from the peptide ELGQSGVDTYLQTK (m/z 773.8955, 2+) at five different concentrations. Mass measurement error and retention time of the most intense transition is annotated above the peak. The vertical lines on either side of the peak indicate the integration boundaries for the peak. Bottom right plot: the total integrated fragment ion signal for the peptide at different concentrations is plotted as a bar graph; contribution from each individual fragment ion is displayed as a different color in the bars. Dot product (dotp) value indicates the degree of the match between spectral library MS/MS (Figure 4a) and the extracted ion chromatograms of the corresponding transitions [47]; high dotp indicates the absence of interfering signals [5]; (c) Total integrated area of the peaks of peptide ELGQSGVDTYLQTK at five different concentrations; (d) Scatter plot between expected ratios and observed ratios shows excellent correlation (R2 = 0.99). Skyline was used to analyze the PRM data.

