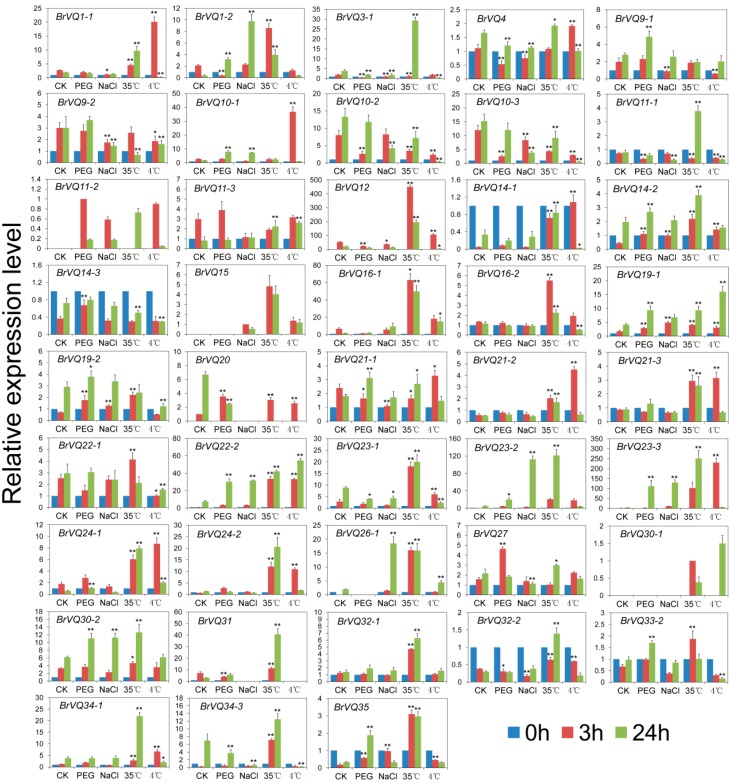
Figure 8.
Expression analysis of the BrVQ genes under abiotic stresses. Three-week-old plants were treated with 20% (w/v) PEG6000, 20 mmol/L NaCl, 35 °C, and 4 °C for 0, 3, and 24 h before the mature leaves were harvested. Expression of the BrVQ genes were normalized to those of BrActin and shown relative to the expression of CK at 0 h, except for four BrVQ genes (11-2, 15, 20, 30-1), whose expression levels were related to the expression of CK treated with PEG, NaCl, CK, 35 °C at 3 h, respectively. The 2−ΔΔCt method was used to calculate the expression of target genes in different tissues. * indicated that the expression level is significantly different from the value of the control (* p < 0.05, ** p < 0.01).

