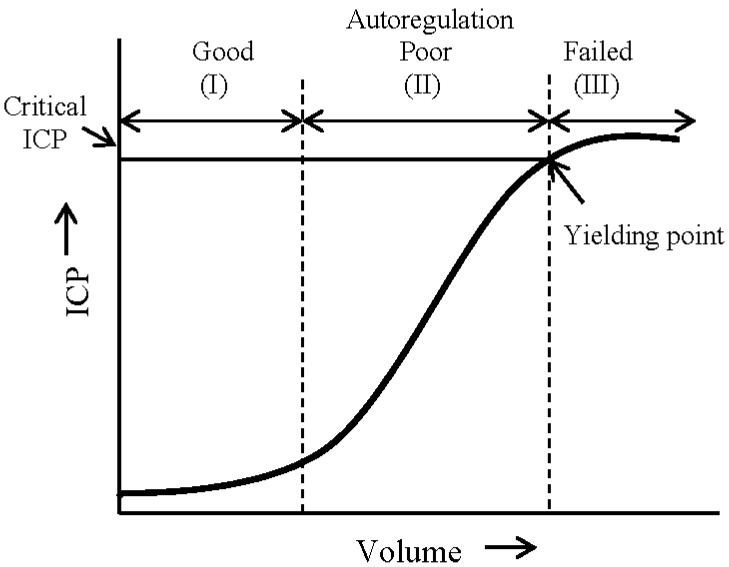
Figure 1.
A pressure–volume curve representing the relation between cranial volume and ICP. The three sections on this curve show the regions of good (I), poor (II), and failed (III) compensatory mechanisms which are involved in autoregulation of cerebrovascular reactivity (modified from [3]).

