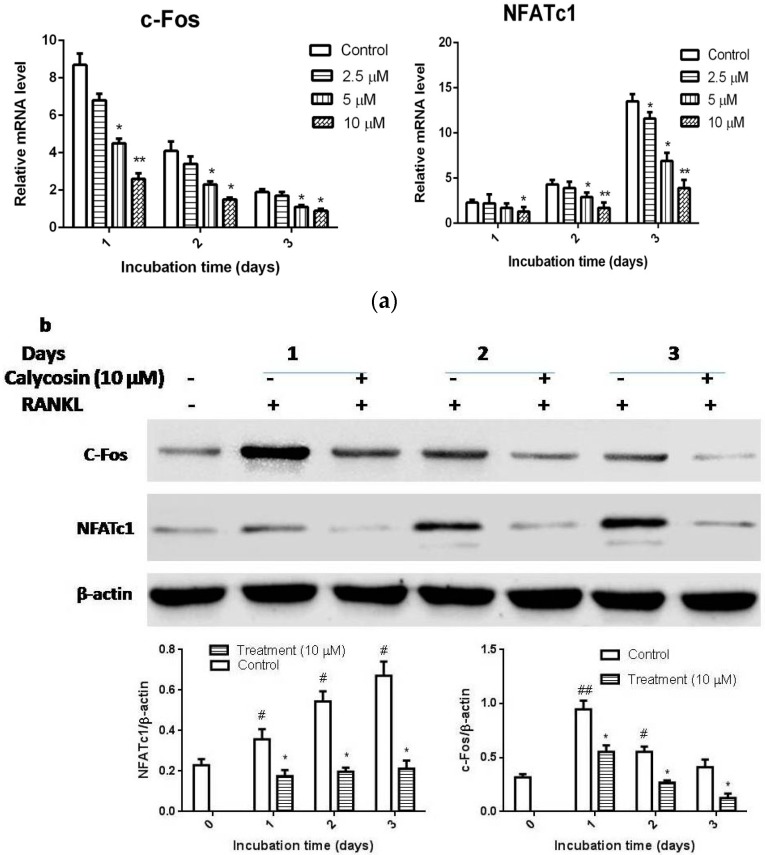
Figure 4.
Effects of calycosin on the expression of c-Fos and NFATc1. BMMs were cultured with 20 ng/mL of M-CSF and 20 ng/mL of RANKL in the presence or absence of indicated dose of calycosin for one, two, or three days. (a) The mRNA expression levels of c-Fos and NFATc1 were examined by quantitative real-time PCR; and (b) the protein levels of c-Fos and NFATc1 were examined by western blot. The relative quantification of target proteins was calculated by comparison of the bands density levels between samples. The results were expressed as means ± SD from three independent experiments. * p < 0.05 vs. control. # p < 0.05 and ## p < 0.01 vs. vehicle-treated group.

