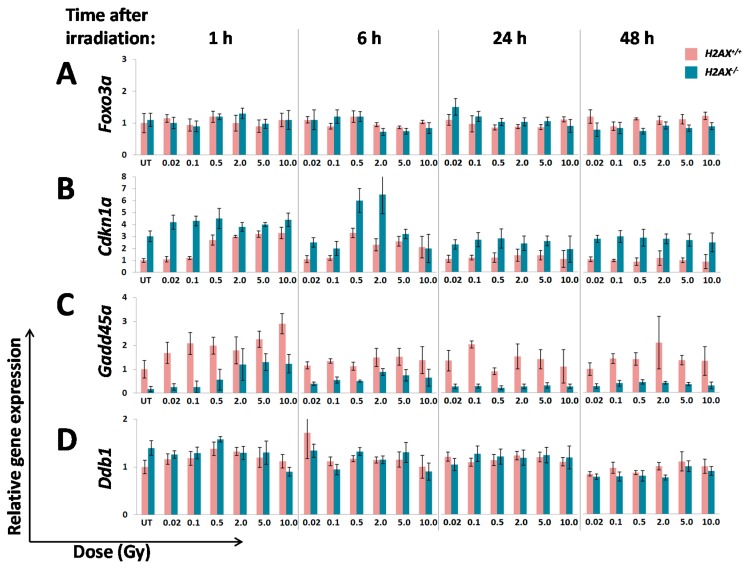
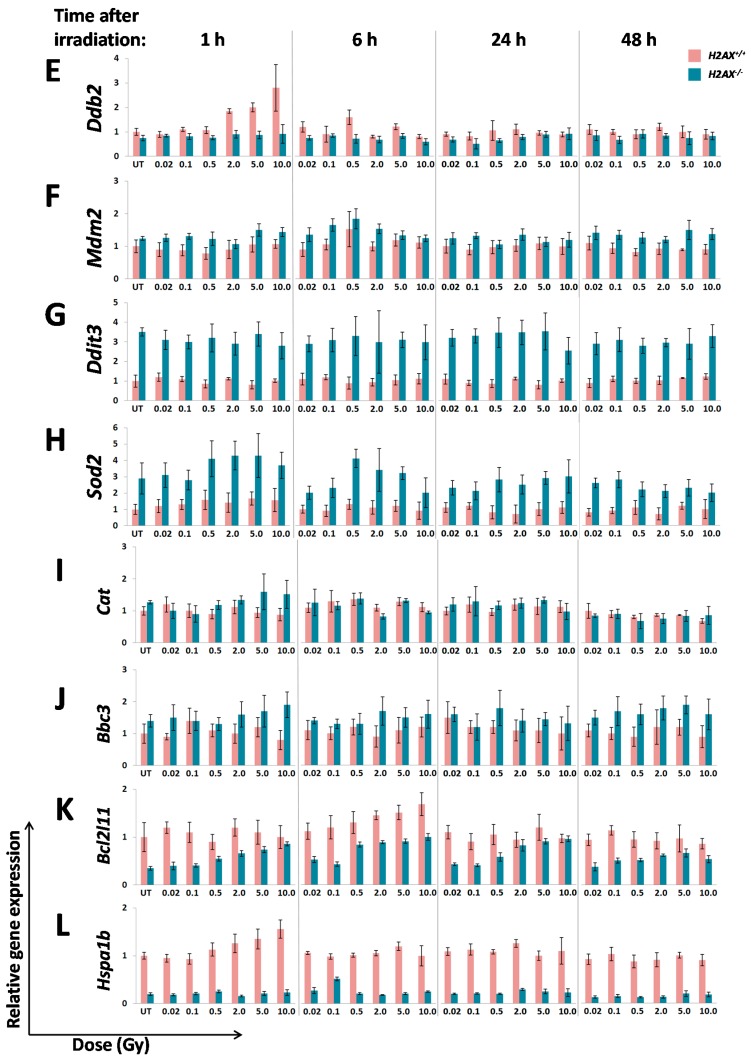
Figure 3.
Radiation dose responses and time courses of the expression of genes regulated by FoxO3a in H2AX+/+ and H2AX−/− MEFs. Cells were irradiated with the indicated doses of γ-radiation and at 1, 6, 24 and 48 h RNA was extracted and the expression of Foxo3a (A); Cdkn1a (B); Gadd45α (C); Ddb1 (D); Ddb2 (E); Mdm2 (F); Ddit3 (G); Sod2 (H); Cat (I); Bbc3 (J); Bcl2l11 (K); and Hspa1b (L) were measured using RT-qPCR as described in Experimental Section. The expression values shown are relative to corresponding untreated controls and were calculated using the ∆Ct method as described in Figure 2. Data for each time-point had its own control, however, shown are only 1 h controls due to space limitation. Data represent the mean ± SD obtained from three independent experiments.


