Figure 2.
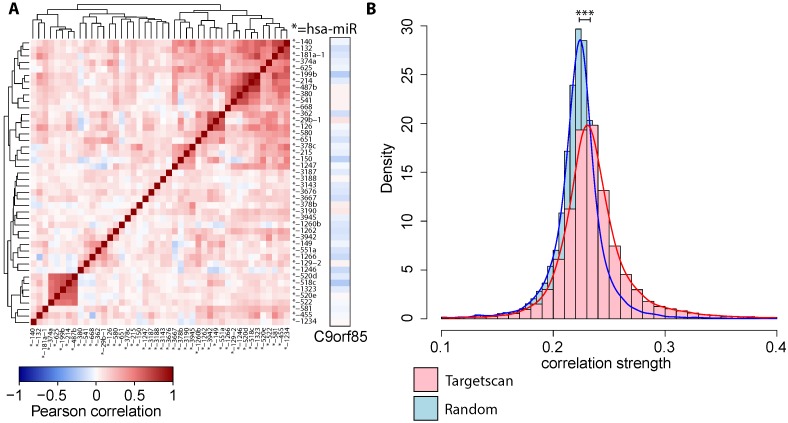
Collective effects of co-expressed miRNAs. (A) Pairwise correlation of putative, expressed miRNA regulators together with their target gene C9orf85 (obtained from the HNSCC dataset). The miRNAs are themselves clustered into several co-expressed groups; (B) The distribution of correlation strengths of miRNA sets, which are predicted to target a common gene, (red curve and histogram) is higher than for randomly re-sampled mi-/mRNA associations (blue, Wilcoxon rank sum test has ) in the HNSCC miRNA expression dataset.

