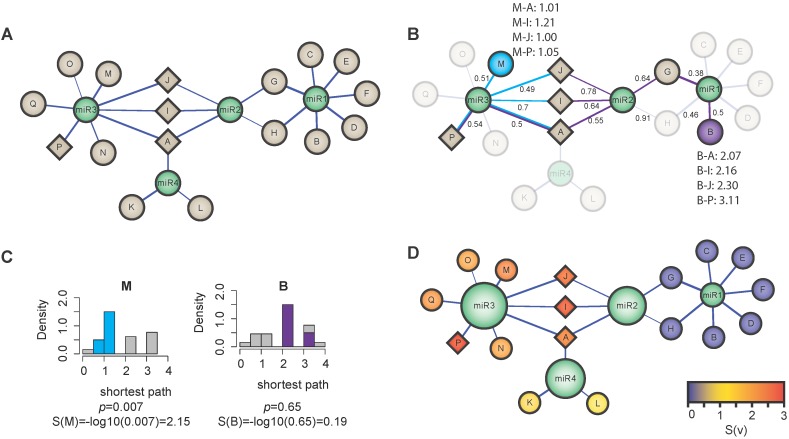
Figure 3.
Node scoring strategy of local enrichment analysis. (A) Example of a network in which the nodes are represented by miRNAs (green) and genes (grey) and the edges are represented by the mi-/mRNA interactions. The network is given as input for the functional annotation step. We assume that four genes are assigned to a certain functional group—A, I, J, P (diamond shape); (B) The transformed network after computing the shortest path distances between these four nodes and the two nodes M (blue) and B (purple). The edge labels denote the weights after the transformation. The edge weight indicates the strength of the mi-/mRNA negative regulation; (C) The distribution of shortest paths from node M to the nodes A, I, J and P is significantly shifted to lower values. No shift can be observed for node B. The p-values determined by left-tailed Wilcoxon rank-sum test are converted to the node scores; (D) Network visualization after annotating functional groups. The node scores are indicated by the color. The size of the miRNA nodes corresponds to the miR score.

