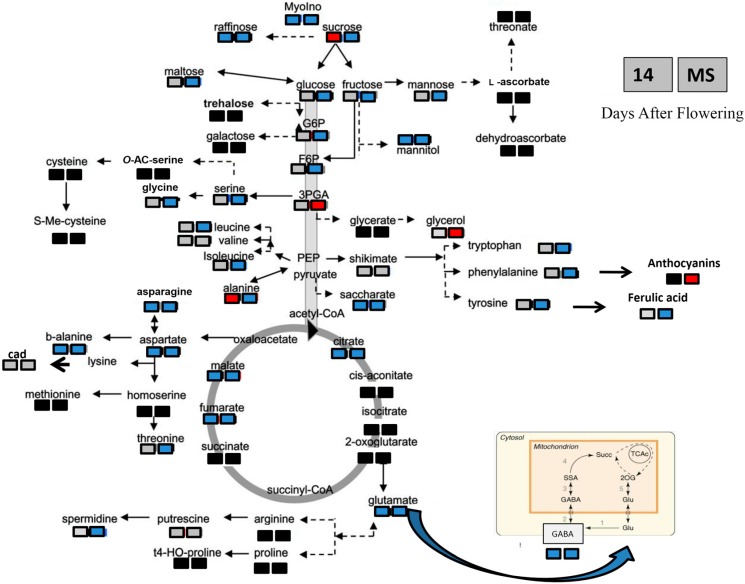
Figure 3.
Changes in metabolite profiles for the “T1303” seeds, for the control compared with the heat-stressed conditions, for the immature (14 DAF) and mature (MS) stages of seed development. Changes in the metabolite levels were calculated as the ratios between the levels for the heat stress and the control. To visualize the changes, significant increases and decreases are indicated in red and blue, respectively, within a metabolic scheme (p < 0.05; Student’s t tests). b-alanine, β-Alanine; GABA, γ-4-aminobutyric acids. Solid line arrows: single step reactions; dash line arrows: pathways composed of more than one reaction; light gray shape: compounds which are not significantly different in seeds from heat stressed plants and control; red shape: compounds whose level is higher in seeds from heat stressed plants compared to control; blue shape: compounds whose level is lower in seeds from heat stressed plants compared to control; black shape: compounds not evaluated in the present study. The metabolic scheme is modified from [71].

