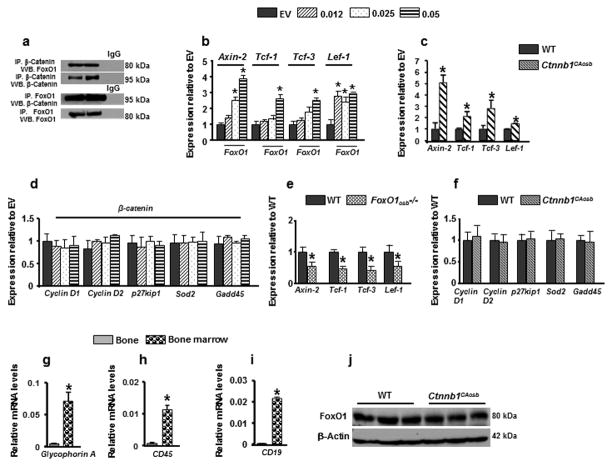
Figure 1. FoxO1 interacts with β-catenin in osteoblasts.
(a) Coimmunoprecipitation (IP) of β-Catenin and FoxO1 in cell lysates from osteoblast cells followed by immunoblot analysis. Blots were representatives of n=3. (b–f) Real-Time PCR analysis of (b) Axin-2, Tcf-1, Tcf-3 and Lef-1 expression in osteoblasts transfected with increasing concentrations of FoxO1 construct. EV denotes Empty vector. Data are representative of 3 independent experiments. *p < 0.05 versus EV-transfected cells. (c) Real-Time PCR analysis of Axin-2, Tcf1, Tcf-3 and Lef-1 in the bones of wild type and Ctnnb1CAosb mice (Identical data are shown in Figure 2b–e). (d) Real-Time PCR analysis of Cyclin D1, Cyclin D2, p27kip1, Sod2 and Gadd45 expression in osteoblasts transfected with increasing concentrations of β-catenin. EV denotes Empty vector. Data are representative of three independent experiments. *p < 0.05 versus EV-transfected cells. (e) Quantitative Real-Time PCR analysis of Axin-2, Tcf1, Tcf-3 and Lef-1 in the bones of wild type and FoxO1osb−/− mice. Total RNA was isolated from flushed long bones. n=4. *p < 0.05 versus wild type. (f) Quantitative Real-Time PCR analysis of Cyclin D1, Cyclin D2, p27kip1, Sod2 and Gadd45 gene expression in bones of wild type and Ctnnb1CAosb mice. Total RNA was isolated from flushed long bones. (g–i) Real-Time PCR analysis of (g) glycophorin A (h) CD45 (i) CD19 in the flushed long bones and bone marrow. n=4. *p < 0.05 versus WT. (j) Immunoblot analysis showing FoxO1 protein levels in bones lysates of wild type and Ctnnb1CAosb mice. Blot is representative of n=3. Results are mean ± SD. All mice were 1 month of age.

