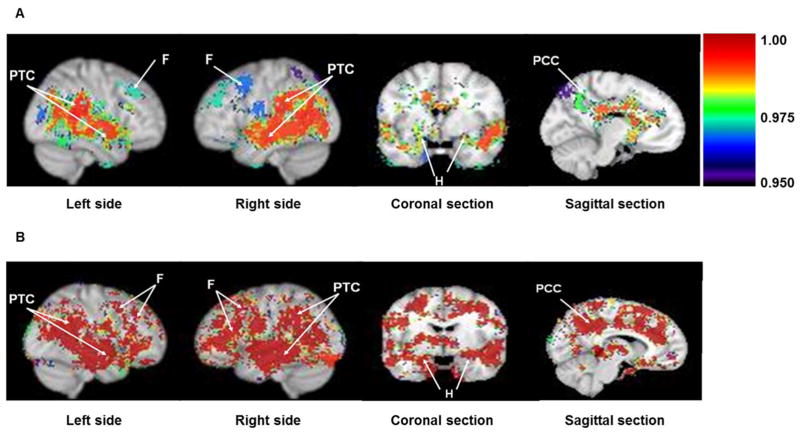
Figure 1.
Difference in regional cerebral blood flow (rCBFc) (A) and relative verapamil extraction ratio (ERc) (B) in AD vs. Controls. Grouped statistical brain parametric image comparisons (AD vs. controls) in sagittal, coronal and mid-sagittal planes show significant decrease in rCBFc (A) or P-gp activity (higher ERc) (B) in parietotemporal cortex (PTC), frontal lobe (F), hippocampus (H) and posterior cingulate cortex (PCC) in AD patients. Colored statistical parametric grouped brain images are shown as a thresholded overlay (threshold set to 0.95 which equals p=0.05) on top of the standard Montreal Neurological Institute (MNI) brain made from 152 coregistered brains placed into standardized MNI coordinate space. Color index is shown as probability statistical values (1-p) with higher significance represented as a higher value (i.e. lower CBFc in A and greater ERc or lower P-gp activity in B).

