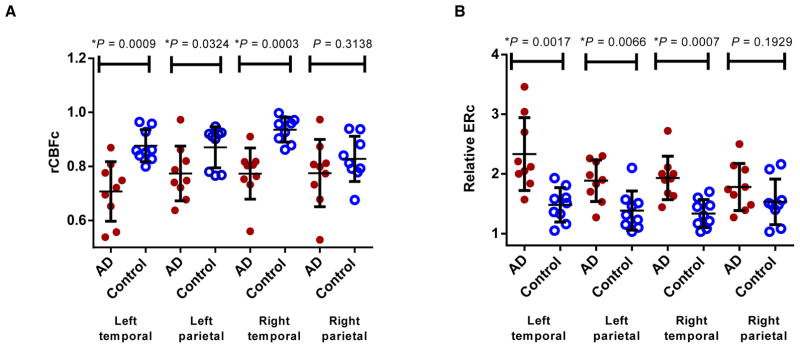
Figure 2.
Regions of interest analysis (ROI) in AD vs Control. ROI analysis of the parametric maps shows significantly lower regional cerebral blood flow (rCBF) (A) and P-gp activity (higher relative verapamil extraction ratios (ERc)) (B) in the temporal and left parietal cortices of AD patients vs. controls. Data are shown as mean±SD.

