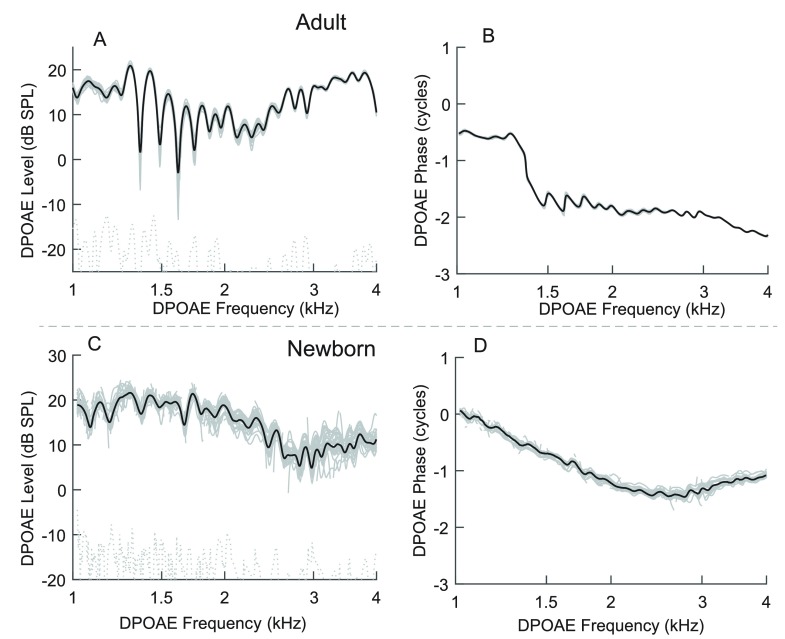
FIG. 1.
(A) and (B) DPOAE recorded with swept tones and analyzed in one adult ear (sweep rate: 0.5 octave/s, analysis-window duration: 125 ms). The thin gray lines represent DPOAE level and phase estimates from each of 24 individual sweeps. The thicker black line is the complex average derived from the individual sweep-based estimates. The noise floor is shown as dotted light gray. (C) and (D) DPOAE from one newborn ear recorded and analyzed in the same way as described for the adult ear, however, with more sweeps (n = 32). The thin gray lines in all panels depict the variance of repeated DPOAE estimates within an ear and provide a measure of intra-subject response stability.

