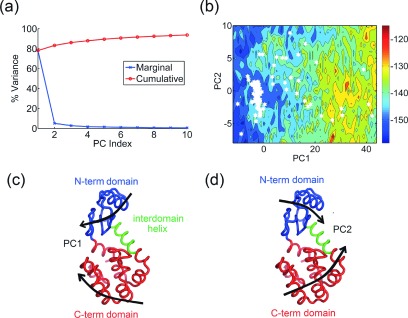
FIG. 2.
Bacteriophage T4 lysozyme. (a) Percentage of variance captured by the first 10 PCs from a set of 183 T4 lysozyme structures. (b) and (c) Visualization of PC1 and PC2 on the protein structure (thick black arrows) as a combination of hinge-bending and twisting motions of the N-term domain (blue) with respect to the C-term domain (red). (d) Energy landscape of human lysozyme along the PC1-PC2 coordinates (entropy weight a = 0). Crystal structures are denoted by white hexagons. The large cluster at lower values of PC1 corresponds to closed structures whereas the open structures are more broadly scattered along PC1 and PC2.

